
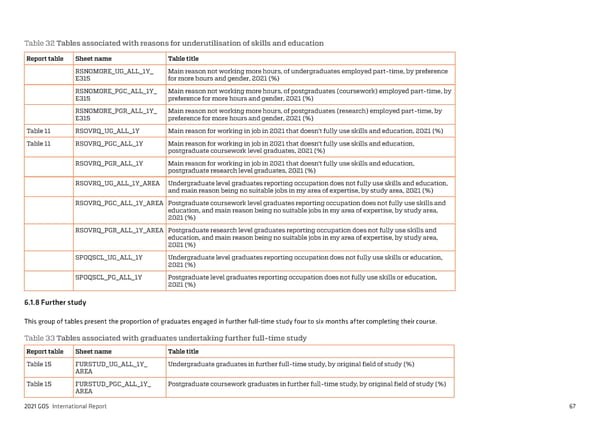
Table 32 Tables associated with reasons for underutilisation of skills and education Report table Sheet name Table title RSNOMORE_UG_ALL_1Y_ Main reason not working more hours, of undergraduates employed part-time, by preference E315 for more hours and gender, 2021 (%) RSNOMORE_PGC_ALL_1Y_ Main reason not working more hours, of postgraduates (coursework) employed part-time, by E315 preference for more hours and gender, 2021 (%) RSNOMORE_PGR_ALL_1Y_ Main reason not working more hours, of postgraduates (research) employed part-time, by E315 preference for more hours and gender, 2021 (%) Table 11 RSOVRQ_UG_ALL_1Y Main reason for working in job in 2021 that doesn’t fully use skills and education, 2021 (%) Table 11 RSOVRQ_PGC_ALL_1Y Main reason for working in job in 2021 that doesn’t fully use skills and education, postgraduate coursework level graduates, 2021 (%) RSOVRQ_PGR_ALL_1Y Main reason for working in job in 2021 that doesn’t fully use skills and education, postgraduate research level graduates, 2021 (%) RSOVRQ_UG_ALL_1Y_AREA Undergraduate level graduates reporting occupation does not fully use skills and education, and main reason being no suitable jobs in my area of expertise, by study area, 2021 (%) RSOVRQ_PGC_ALL_1Y_AREA Postgraduate coursework level graduates reporting occupation does not fully use skills and education, and main reason being no suitable jobs in my area of expertise, by study area, 2021 (%) RSOVRQ_PGR_ALL_1Y_AREA Postgraduate research level graduates reporting occupation does not fully use skills and education, and main reason being no suitable jobs in my area of expertise, by study area, 2021 (%) SPOQSCL_UG_ALL_1Y Undergraduate level graduates reporting occupation does not fully use skills or education, 2021 (%) SPOQSCL_PG_ALL_1Y Postgraduate level graduates reporting occupation does not fully use skills or education, 2021 (%) 6.1.8 Further study This group of tables present the proportion of graduates engaged in further full-time study four to six months after completing their course. Table 33 Tables associated with graduates undertaking further full-time study Report table Sheet name Table title Table 15 FURSTUD_UG_ALL_1Y_ Undergraduate graduates in further full-time study, by original field of study (%) AREA Table 15 FURSTUD_PGC_ALL_1Y_ Postgraduate coursework graduates in further full-time study, by original field of study (%) AREA 2021 GOS International Report 67
 2021 International Graduate Outcomes Survey - QILT Page 71 Page 73