
2021 International Graduate Outcomes Survey - QILT
shorshortt--terterm gradum graduaatete outoutccomes in aomes in australiaustralia JJaannuuaarryy 22002222 2021 International Graduate Outcomes Survey
Acknowledgements The Quality Indicators for Learning and Teaching (QILT) survey program, including the 2021 Graduate Outcomes Survey (GOS), is funded by the Australian Government Department of Education, Skills and Employment. Without the active support of Rachel Lloyd, Phil Aungles, Dr Sam Pietsch, Gabrielle Hodgson, Ravi Ravindiran, Wayne Shippley, Dr Barbara Sidwell and Ben McBrien this research would not be possible. The Social Research Centre would especially like to thank the higher education institutions that contributed to the GOS in 2021. Without the enthusiastic and committed assistance of the survey managers and institutional planners, the 2021 GOS would not have been such a success. We are also very grateful to the graduates who took the time to provide valuable feedback about their employment, further study and experience with their course. The GOS data will be used by institutions for continuous improvement, and to monitor and improve the labour force outcomes of graduates in the short term. The 2021 GOS was led by Graham Challice, and the project team consisted of Lisa Bolton, Natasha Vickers, James Morrison, Cynthia Kim, Dr Paddy Tobias, Dean Pennay, Benjamin Desta, Gabriel Ong, Daniel Rosenblatt, Joe Feng, Luke Hand, Sean Walker and Kelsey Pool. For more information on the conduct and results of the 2021 GOS see the QILT website: www.qilt.edu.au. The QILT team can be contacted by email at qilt@srcentre.com.au. 2021 GOS International Report i
Contents Acknowledgements i Contents ii List of tables iii List of figures iv 1. Introduction 1 2. Overall results 2 3. Skills utilisation 19 4. Further study 21 Appendix 1 Methodology 25 Appendix 2 Labour market and graduate satisfaction definitions 35 Appendix 3 GOS questionnaire 37 Appendix 4 Construction of confidence intervals 57 Appendix 5 Study area concordance 58 Appendix 6 Additional tables and figures 61 2021 GOS International Report ii
List of tables Table 1 Graduate employment and study outcomes by level of study, international and Table 16 Broad field of education destinations of international graduates in full-time study, domestic graduates, 2019, 2020 and 2021 2 by level of original study, 2021 (%) 24 Table 2 International graduate employment outcomes by residence at time of survey, 2021 Table 17 2021 GOS operational overview, international graduates 25 (%) 4 Table 18 2021 GOS response rate by course level, international graduates 26 Table 3 Undergraduate employment outcomes by home country of international graduates, Table 19 2021 GOS university response rates (All study levels), international graduates 27 2021 7 Table 4 Postgraduate coursework employment outcomes by home country of international Table 20 2021 GOS NUHEI response rates (All study levels), international graduates 29 graduates, 2021 8 Table 21 2021 International GOS response characteristics and population parameters by Table 5 Postgraduate research employment outcomes by home country of international subgroup* 32 graduates, 2021 8 Table 22 2021 GOS population parameters by study area and response characteristics, Table 6 Undergraduate employment outcomes by study area, international and domestic international graduates 34 graduates, 2021 9 Table 23 2021 GOS population parameters by study area and response characteristics 35 Table 7 Postgraduate coursework employment outcomes by study area, international and Table 24 Item summary 37 domestic graduates, 2021 10 Table 25 Study area concordance 58 Table 8 Undergraduate employment outcomes by university, international graduates, 2019- Table 26 Tables and figures associated with labour force outcomes 61 2021 12 Table 9 Undergraduate employment outcomes by NUHEI, international graduates, 2019- Table 27 Tables associated with median usual hours and median actual hours worked 64 2021 16 Table 28 Tables associated with the percentage of employed graduates away from work Table 10 Graduates employed in managerial and professional occupations by employment 65 type and study level, international and domestic graduates, 2021 (% of those employed) Table 29 Tables associated with occupation types of employed graduates 65 19 Table 30 Tables associated with the extent to which graduates considered their Table 11 Main reason for working in job in 2021 that does not fully use skills and education, qualification important 66 by study level, full-time employed international and domestic graduates, 2021 (%) 20 Table 31 Tables associated with the extent to which the qualification prepared graduates for Table 12 Undergraduates in further full-time study, by home country, 2021 (%) 21 their current job 66 Table 13 Postgraduate coursework graduates in further full-time study, by home country, Table 32 Tables associated with reasons for underutilisation of skills and education 67 2021 (%) 22 Table 33 Tables associated with graduates undertaking further full-time study 67 Table 14 Postgraduate research graduates in further full-time study, by home country, 2021 Table 34 Tables associated with graduate satisfaction 68 (%) 22 Table 15 International graduates in further full-time study, by original study area and level, Table 35 Tables associated with key project elements and response rates by institution 69 2021 (%) 23 Table 36 Tables associated with response characteristics and representativeness 70 2021 GOS International Report iii
List of figures Figure 1 Undergraduate full-time employment rate by residence at time of survey (%) 5 Figure 2 Undergraduate median full-time salary, international and domestic graduates (%) 6 Figure 3 Undergraduate full-time employment rates by university, international graduates, 2019-2021 (%) 14 Figure 4 Undergraduate median full-time salaries by university, international graduates, 2019-2021 ($) 15 Figure 5 Undergraduate full-time employment rates by NUHEI, international graduates, 2019-2021 (%) 18 Figure 6 Formula for a 90 per cent confidence interval using the Agresti-Coull method with FPC 57 2021 GOS International Report iv
1. Introduction This report presents data on graduate employment outcomes for international students at Australian higher education institutions, approximately four to six months after they have completed their studies. Information is drawn from the Graduate Outcomes Survey (GOS), an annual survey conducted on behalf of the department by the Social Research Centre as part of the Quality Indicators for Learning and Teaching (QILT) program. In 2021, the GOS gathered over 35,000 responses from international graduates, with a response rate of 33.6 per cent. Results from the GOS for domestic graduates are published in a national report on the QILT website and in an interactive comparison tool at the institution by study area level on the ComparED website. Although international graduates have always been in scope for the GOS, results have not previously been published. It is envisaged that data for international graduates will be available annually from 2021. Consistent with the department’s reporting of international student enrolments and completions, international graduates are defined in this report as graduates who were recorded as having non-Australian citizen status in the Higher Education Information Management System (HEIMS) at the time they were enrolled as students (with the exception of New Zealand citizens and students on humanitarian visas, who are considered to be domestic students). Unless otherwise noted, graduate outcomes refer to graduates living both in Australia and overseas at the time of the survey. The exception is for salaries, which refers to graduates employed full-time within Australia only. Because data is drawn from a survey to which only a subset of graduates respond, analysis can be affected both by the total number of survey responses and by how representative those responses received are of the total graduate population. In this report, data is not reported where there are fewer than 25 survey responses, as indicated by ‘n.a.’ in tables. For institution level data, 90 per cent confidence intervals are presented to aid in interpreting results. It is known that GOS data is not representative by international graduates’ country of origin, with Chinese graduates in particular being under-represented. It is unknown how representative the survey is in relation to whether a graduate is living in Australia or overseas at the time of the survey. The department is continuing to work with SRC to improve both overall survey response rates and data representativeness for international graduates. Further information on survey methodology and data representativeness can be found in Appendix 1 of this report. Definitions of labour market outcomes are presented in Appendix 2 of this report. 2021 GOS International Report 1
2. Overall results Table 1 presents employment outcomes for international and domestic graduates by study level, for 2019 to 2021. Two general points are readily apparent. First, there has been no further decline in graduate employment rates for both domestic and international graduates in 2021. There was a broad decline in graduate employment rates between 2019 and 2020, for both domestic and international graduates. 43.0% This was associated with general weakness in the Australian labour market observable from 2019, which was worsened in 2020 by measures introduced to contain the COVID-19 pandemic. International graduates were affected by this downturn to an even greater extent international undergraduates in than domestic graduates. Results from 2021 show some minor improvement on 2020, with undergraduate full-time employment rates up full-time employment (2021) by 0.6 percentage points for international graduates and 0.2 percentage points for domestic graduates. Second, international graduate employment rates are consistently lower than for their domestic counterparts. For undergraduates, the 2021 full-time employment rate for international graduates was 43.0 per cent compared with 68.9 per cent for domestic graduates, a difference of 25.9 percentage points. At postgraduate coursework level, the difference between international and domestic full-time 64.6% employment was larger, at 41.0 percentage points. The gap was narrower at postgraduate research level at 8.3 percentage points. international undergraduates in Table 1 Graduate employment and study outcomes by level of study, international and domestic overall employment (2021) graduates, 2019, 2020 and 2021 International Domestic 2019 2020 2021 2019 2020 2021 Full-time employment (%) Undergraduate 49.7 42.4 43.0 72.2 68.7 68.9 Postgraduate coursework 50.3 44.3 43.9 86.8 85.6 84.9 Postgraduate research 75.7 74.2 69.4 81.1 80.1 77.7 Overall employed (%) Undergraduate 65.2 62.2 64.6 86.8 85.1 84.8 Postgraduate coursework 68.7 67.2 70.1 92.7 91.6 90.8 Postgraduate research 85.5 83.8 82.2 90.7 90.0 88.1 2021 GOS International Report 2
International Domestic 2019 2020 2021 2019 2020 2021 Labour force participation rate (%) 54.3k Undergraduate 77.8 78.1 80.8 92.4 91.4 92.0 international undergraduates Postgraduate coursework 91.1 90.4 91.9 96.3 95.5 95.4 median salary (2021) Postgraduate research 95.3 95.4 94.4 93.9 94.3 94.8 Median salary, employed full-time ($) Undergraduate 51,100 53,000 54,300 62,600 64,700 65,000 Postgraduate coursework 52,200 52,800 54,800 85,300 87,400 89,700 54.8k Postgraduate research 83,000 85,000 86,900 90,000 93,000 95,000 international postgraduate In full-time study (%) coursework graduates median Undergraduate 33.5 33.8 33.7 18.9 18.5 21.1 salary (2021) Postgraduate coursework 13.5 14.4 15.0 6.0 6.6 7.6 Postgraduate research 10.5 9.8 11.1 5.8 6.9 6.8 Note: Median salary figures only include data for international graduates working in Australia. 86.9k Overall employment rates (which includes graduates working on a full-time, part-time or casual basis) followed a similar pattern in 2021. international postgraduate International graduates recorded lower overall employment rates than domestic graduates by a margin of 20.2 percentage points for research graduates median salary undergraduates, 20.7 percentage points at postgraduate coursework level and 5.9 percentage points at postgraduate research level. (2021) For undergraduates, labour force participation was also lower for international than for domestic graduates in 2021, at 80.8 per cent and 92.0 per cent respectively. However, the difference in labour force participation was less pronounced at postgraduate coursework level (91.9 percent international, 95.4 per cent domestic) and postgraduate research level (94.4 per cent international, 94.8 per cent domestic). The lower labour force participation of international graduates is partly explained by high rates of further study, as discussed below. For those graduates who are employed full-time in Australia, median salaries are also consistently lower for international than domestic graduates. For undergraduates, the median salary in 2021 was $54,300 for international graduates, compared with $65,000 for domestic graduates, a difference of $10,700. The salary differential was even more pronounced at postgraduate coursework level, at $34,900. It is noticeable that the median salary was only slightly higher for international graduates at postgraduate coursework level than at undergraduate level. Again, the difference between salaries was less pronounced at postgraduate research level, at $8,100. 2021 GOS International Report 3
It is also notable that rates of further study are consistently higher for international graduates than for domestic graduates, across all levels of initial study. The further full-time study rate for undergraduates was around one third or 33.7 per cent compared with 21.1 per cent for domestic undergraduates; a difference of 12.6 percentage points. At postgraduate coursework level, 15.0 per cent of international graduates are in further full-time study compared with 7.6 per cent and for postgraduate research, 11.1 per cent compared with 6.8 per cent. Table 2 presents employment outcomes for international graduates disaggregated by whether the respondent was in Australia or overseas at time of survey. Across all study levels, full-time employment rates were higher for graduates who were living overseas at the time of the survey. There was less difference between the two groups in terms of overall employment and labour force participation rates. Caution should be used in interpreting these results, because as noted earlier, it is unknown how representative survey responses are in relation to current location of the graduate. There are also a substantial number of graduates for whom current location is unknown. Changes to the survey questionnaire are expected to reduce the latter problem in future years. Table 2 International graduate employment outcomes by residence at time of survey, 2021 (%) Undergraduate Postgraduate coursework Postgraduate research In Australia Overseas In Australia Overseas In Australia Overseas Full-time employment 41.6 52.8 41.4 62.0 62.8 82.7 Overall employed 67.2 57.3 72.4 66.7 81.9 85.8 Labour force participation rate 82.1 75.9 93.5 90.4 94.4 96.3 2.1 Time series Figure 1 shows trends in the full-time employment rate among domestic and international undergraduates. Employment improved among domestic undergraduates between 2016 and 2018 in line with the strengthening labour market before turning down slightly in 2019 as the labour market weakened. The COVID-19 pandemic and associated downturn in economic and labour market activities resulted in employment of domestic undergraduates declining further in 2020. With the easing of public health measures in early 2021 there was a slight recovery in the full-time employment rate among domestic undergraduates. The full-time employment rate among international undergraduates has declined from 51.5 per cent in 2016 to 43.0 per cent in 2021. As noted above, the impact of the COVID-19 pandemic has been greater among international graduates than domestic graduates. The full-time employment rate among international undergraduates declined by 6.7 percentage points between 2019 and 2021 in comparison with a smaller decline of 3.3 percentage points among domestic undergraduates. Data on residence status at the time of the survey for international graduates is only available since 2018. This shows that the fall in employment as a result of the COVID-19 pandemic and associated decline in economic and labour market activities has been greater among international graduates residing overseas than among those continuing to reside in Australia. The fall in full-time employment rate among international undergraduates residing in Australia between 2019 and 2021 was 2.7 percentage points whereas this was much larger, 10.4 percentage points, among international undergraduates residing overseas. 2021 GOS International Report 4
Figure 1 Undergraduate full-time employment rate by residence at time of survey (%) Domestic International International in Australia International overseas 80.0% 75.0% 71.8% 72.9% 72.2% 70.9% 70.0% 68.7% 68.9% 65.8% 65.0% 63.2% 60.0% 55.0% 53.0% 52.8% 51.5% 50.5% 50.2% 49.7% 50.0% 45.0% 42.4% 43.0% 44.8% 44.3% 40.0% 41.6% 39.2% 35.0% 30.0% 2016 2017 2018 2019 2020 2021 2021 GOS International Report 5
Figure 2 Undergraduate median full-time salary, international and domestic graduates (%) Domestic International 70,000 64,700 65,000 65,000 62,600 61,000 60,000 55,000 54,300 53,000 51,100 51,100 50,000 45,000 40,000 2018 2019 2020 2021 Note: Median salary figures only include data for graduates working in Australia. The median salary of domestic undergraduates employed full-time increased from $61,000 in 2018 to $65,000 in 2021, an increase of 7 per cent, as shown by Figure 2. By way of comparison, the median salary of international undergraduates employed full-time (residing in Australia) increased from $51,100 to $54,300, up 4 per cent. 2021 GOS International Report 6
2.2 Home country Table 3, Table 4, and Table 5 present employment outcomes for international graduates disaggregated by the graduate’s home country Undergraduates full-time and level of study. The countries are ordered based on number of survey responses at that study level. In prior years, home country employment rate by top 10 was determined by country of birth information record in HEIMS, however for 2021 data, home country is determined by the location of home countries, 2021 permanent home residence information recorded in HEIMS. There was considerable variation in outcomes by home country in 2021 for all study levels. For example, among the largest 10 home countries, undergraduate full-time employment rates ranged from a high of 62.4 per cent for Singaporean graduates down to 32.3 per cent for Sri Lankan graduates. Postgraduate coursework graduate full-time employment rates ranged from a high of 62.8 per cent for Filipino 62.4% graduates down to 35.1 percent for graduates from Bhutan. More detailed analysis would be required to understand the factors that might (Singapore - highest) be impacting these, for example the mix of fields of education studied and labour market conditions in graduates’ home countries. Table 3 Undergraduate employment outcomes by home country of international graduates, 2021 Full-time Overall Labour force Median salary, Country employment (%) employed (%) participation rate (%) employed full-time ($) 32.3% China 36.4 48.5 59.8 52,200 (Sri Lanka - lowest) Nepal 37.7 76.3 94.7 51,700 Malaysia 49.7 64.3 87.3 52,200 India 41.7 72.1 93.1 52,200 Vietnam 43.9 67.5 86.7 51,700 Hong Kong 44.1 57.7 82.0 59,000 Singapore 62.4 71.8 88.7 60,500 Indonesia 37.8 61.8 84.0 50,000 Sri Lanka 32.3 65.0 90.1 52,600 Philippines 45.2 81.6 95.6 58,400 All international graduates 43.0 64.6 80.8 54,300 Note: Median salary figures only include data for international graduates working in Australia. Top ten countries by number of responses received are shown in descending order. 2021 GOS International Report 7
Table 4 Postgraduate coursework employment outcomes by home country of international graduates, 2021 Full-time Overall Labour force participation Median salary, employment (%) employed (%) rate (%) employed full-time Country ($) India 35.8 71.6 93.8 52,200 China 44.2 57.4 84.8 52,200 Nepal 37.4 79.3 95.9 48,000 Indonesia 61.9 72.3 92.9 55,000 Sri Lanka 41.3 70.7 90.9 57,000 Vietnam 48.7 69.6 90.2 55,100 Pakistan 37.4 64.6 94.5 53,100 Philippines 62.8 80.6 96.6 60,000 Bangladesh 45.0 76.8 95.6 51,100 Bhutan 35.1 77.6 96.6 47,600 All international graduates 43.9 70.1 91.9 54,800 Note: Median salary figures only include data for international graduates working in Australia. Top ten countries by number of responses received are shown in descending order. Table 5 Postgraduate research employment outcomes by home country of international graduates, 2021 Full-time Overall Labour force participation Median salary, employment (%) employed (%) rate (%) employed full-time Country ($) China 72.2 77.5 91.3 86,900 India 64.0 81.1 94.9 87,400 Vietnam 67.0 87.8 93.9 75,000 Indonesia 84.0 90.9 98.4 n/a Bangladesh 57.1 81.3 98.2 n/a Iran 57.3 77.9 94.5 90,000 Sri Lanka 67.1 79.1 98.9 n/a Malaysia 79.4 87.0 97.2 n/a Pakistan 59.6 75.5 93.0 n/a Germany 70.8 78.8 96.3 n/a All international graduates 69.4 82.2 94.4 86,900 Note: Median salary figures only include data for international graduates working in Australia. Top ten countries by number of responses received are shown in descending order. 2021 GOS International Report 8
2.3 Study area Employment outcomes for international graduates vary considerably by study area, as is also the case for domestic graduates, as shown in Table 6 and Table 7 (results are not shown at postgraduate research level because there are numerous study areas with too few responses 89.0% to report). It should also be noted that a small number of study areas are responsible for most of the survey responses and are therefore driving results (see Table 22). full-time employment rate For undergraduates, international full-time employment rates ranged from a high of 89.0 per cent for Medicine graduates, down to 35.1 per of Medicine international cent for Creative arts graduates. Generally speaking, the fields of education with relatively high full-time employment rates, for example undergraduates - highest (2021) Pharmacy, Rehabilitation, Medicine, and Veterinary science, were similar for both international and domestic graduates. Nonetheless, full- time employment rates were lower for international graduates than for domestic graduates in every study area. At postgraduate coursework level, full-time employment rates ranged from a high of 90.3 per cent for Veterinary science, down to 38.1 per cent for Computing and information systems. Like undergraduates, the fields of education with relatively high full-time employment rates, for example Pharmacy, Medicine, Veterinary science, Rehabilitation, and Dentistry were similar for both international and domestic graduates. Lower rates of full-time employment were recorded for international graduates than for domestic graduates in every study area. Table 6 Undergraduate employment outcomes by study area, international and domestic graduates, 2021 Full-time employment (%) Overall employed (%) Labour force participation rate Median salary, employed (%) full-time ($) Study area International Domestic International Domestic International Domestic International Domestic Science and mathematics 45.2 61.1 57.6 81.5 71.4 84.8 56,300 63,000 Computing and information systems 37.4 67.9 67.7 77.5 85.2 94.5 52,200 65,500 Engineering 44.8 80.3 59.6 86.6 79.8 95.0 55,000 70,000 Architecture and built environment 40.3 65.2 58.6 82.4 73.8 95.0 50,100 62,600 Agriculture and environmental studies 49.2 69.5 65.2 85.9 77.5 92.3 n/a 60,500 Health services and support 48.2 72.5 65.3 88.4 83.3 93.1 57,100 66,500 Medicine 89.0 90.2 86.0 92.9 87.7 92.5 73,100 76,000 Nursing 43.8 74.2 76.0 88.8 93.7 95.8 58,400 65,200 Pharmacy 87.9 95.0 83.3 93.6 90.0 94.7 47,600 50,000 Dentistry n/a 84.5 80.6 94.5 93.9 91.7 n/a 100,000 Veterinary science 84.4 87.0 78.6 90.6 72.4 87.5 n/a 60,000 Rehabilitation 85.9 94.4 92.3 96.0 94.0 97.8 67,800 67,000 Teacher education 75.8 79.1 87.1 91.1 83.3 94.8 62,600 72,000 2021 GOS International Report 9
Full-time employment (%) Overall employed (%) Labour force participation rate Median salary, employed (%) full-time ($) Study area International Domestic International Domestic International Domestic International Domestic Business and management 40.6 72.8 62.3 86.3 77.4 95.9 49,300 60,700 Humanities, culture and social sciences 39.8 57.9 54.0 81.7 76.7 89.9 52,200 62,600 Social work 47.5 70.7 76.3 84.7 94.2 94.2 n/a 72,600 Psychology 37.1 60.2 56.8 83.5 76.8 87.1 n/a 65,000 Law and paralegal studies 36.8 72.5 54.0 84.3 83.3 94.9 n/a 66,800 Creative arts 35.1 49.2 61.1 78.2 81.8 90.6 53,100 53,000 Communications 38.8 55.2 58.8 81.5 81.7 89.0 n/a 56,200 Tourism, hospitality, personal services, n/a 58.7 n/a 82.1 n/a 91.2 n/a 54,900 sport and recreation All study areas 43.0 68.9 64.6 84.8 80.8 92.0 54,300 65,000 Standard deviation 19.8 13.0 12.5 5.3 7.7 3.3 11,100 10,300 Note: Median salary figures only include data for international graduates working in Australia. Table 7 Postgraduate coursework employment outcomes by study area, international and domestic graduates, 2021 Full-time employment (%) Overall employed (%) Labour force participation rate Median salary, employed (%) full-time ($) Study area International Domestic International Domestic International Domestic International Domestic Science and mathematics 46.0 76.0 70.0 85.3 88.7 92.9 54,300 89,700 Computing and information systems 38.1 78.5 68.4 84.8 92.4 95.3 52,200 96,000 Engineering 42.5 86.6 69.9 88.6 92.3 95.3 52,200 93,000 Architecture and built environment 44.7 79.5 68.4 86.0 94.9 96.5 55,000 68,000 Agriculture and environmental studies 53.1 75.2 69.8 88.0 93.3 92.3 50,100 80,000 Health services and support 46.0 84.4 72.5 92.0 93.4 96.1 55,200 91,300 Medicine 88.8 97.1 80.7 96.3 92.9 96.8 78,000 81,400 Nursing 47.6 91.7 79.9 94.8 95.7 96.3 64,800 89,700 Pharmacy 55.2 97.8 66.7 97.3 92.3 93.3 n/a 77,700 Dentistry 68.0 91.3 71.9 95.1 94.1 97.1 n/a 114,000 Veterinary science 90.3 95.3 90.3 96.7 88.6 97.8 n/a 62,300 2021 GOS International Report 10
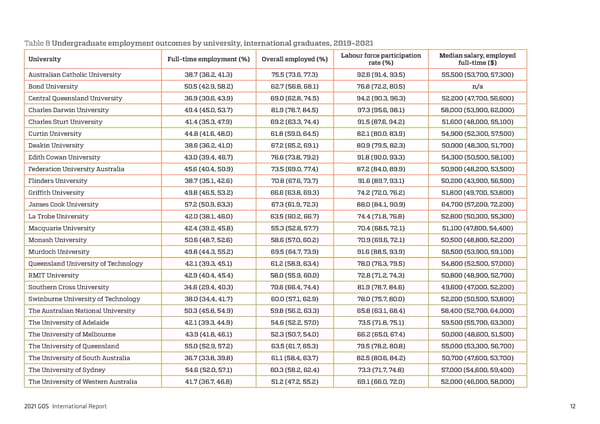
Full-time employment (%) Overall employed (%) Labour force participation rate Median salary, employed (%) full-time ($) Study area International Domestic International Domestic International Domestic International Domestic Rehabilitation 82.3 95.1 88.2 97.1 97.9 97.8 66,800 69,700 Teacher education 55.6 85.4 77.6 93.6 90.1 95.4 63,000 87,600 Business and management 42.3 88.5 69.1 91.6 91.8 96.8 52,200 110,000 Humanities, culture and social sciences 48.7 77.6 68.3 87.0 83.9 90.7 52,200 85,300 Social work 49.3 79.3 79.2 88.7 95.8 95.6 66,500 80,000 Psychology 65.7 83.0 68.0 89.8 92.6 90.4 n/a 86,000 Law and paralegal studies 62.8 83.0 68.3 88.2 91.5 96.8 59,000 76,000 Creative arts 45.5 60.4 64.3 81.3 89.1 95.0 55,500 78,300 Communications 41.2 69.1 61.9 83.4 90.6 93.3 58,000 70,000 Tourism, hospitality, personal services, 47.1 72.4 68.3 90.0 95.3 96.8 n/a n/a sport and recreation All study areas 43.9 84.9 70.1 90.8 91.9 95.4 54,800 89,700 Standard deviation 15.5 9.8 7.4 4.8 3.1 2.2 14,300 12,800 Note: Median salary figures only include data for international graduates working in Australia. 2.4 Institution Across universities, 2.4.1 Universities there was a 22.6 Employment outcomes for undergraduate international graduates by university are shown in Table 8, Figure 1 and Figure 2. Results are percentage point combined across the years 2019, 2020 and 2021. This is consistent with the approach utilised on the ComparED website where results difference between the are pooled across surveys to improve the robustness and validity of the data. To assist interpretation of results, 90 per cent confidence intervals are included. highest and lowest full- Using a three-year aggregation of data, universities with highest full-time employment rates include James Cook University, 57.2 per cent, time employment rates University of New England, 57.1 per cent, The University of Queensland, 55.0 per cent and, Torrens University, 54.7 per cent. In terms of graduate earnings once again based on a three year aggregation of data, international undergraduates from University of Newcastle had among international highest full-time median salaries of $66,600 followed by graduates from James Cook University at $64,700. undergraduates in 2021 2021 GOS International Report 11
Table 8 Undergraduate employment outcomes by university, international graduates, 2019-2021 University Full-time employment (%) Overall employed (%) Labour force participation Median salary, employed rate (%) full-time ($) Australian Catholic University 38.7 (36.2, 41.3) 75.5 (73.6, 77.3) 92.6 (91.4, 93.5) 55,500 (53,700, 57,300) Bond University 50.5 (42.9, 58.2) 62.7 (56.8, 68.1) 76.8 (72.2, 80.5) n/a Central Queensland University 36.9 (30.6, 43.9) 69.0 (62.8, 74.5) 94.2 (90.3, 96.3) 52,200 (47,700, 56,600) Charles Darwin University 49.4 (45.0, 53.7) 81.9 (78.7, 84.5) 97.3 (95.6, 98.1) 58,000 (53,900, 62,000) Charles Sturt University 41.4 (35.3, 47.9) 69.2 (63.3, 74.4) 91.5 (87.6, 94.2) 51,600 (48,000, 55,100) Curtin University 44.8 (41.6, 48.0) 61.8 (59.0, 64.5) 82.1 (80.0, 83.9) 54,900 (52,300, 57,500) Deakin University 38.6 (36.2, 41.0) 67.2 (65.2, 69.1) 80.9 (79.5, 82.3) 50,000 (48,300, 51,700) Edith Cowan University 43.0 (39.4, 46.7) 76.6 (73.8, 79.2) 91.8 (90.0, 93.3) 54,300 (50,500, 58,100) Federation University Australia 45.6 (40.4, 50.9) 73.5 (69.0, 77.4) 87.2 (84.0, 89.9) 50,900 (48,200, 53,500) Flinders University 38.7 (35.1, 42.6) 70.8 (67.6, 73.7) 91.6 (89.7, 93.1) 50,200 (43,900, 56,500) Griffith University 49.8 (46.5, 53.2) 66.6 (63.8, 69.3) 74.2 (72.0, 76.2) 51,800 (49,700, 53,800) James Cook University 57.2 (50.9, 63.3) 67.3 (61.9, 72.3) 88.0 (84.1, 90.9) 64,700 (57,200, 72,200) La Trobe University 42.0 (38.1, 46.0) 63.5 (60.2, 66.7) 74.4 (71.8, 76.8) 52,800 (50,300, 55,300) Macquarie University 42.4 (39.2, 45.8) 55.3 (52.8, 57.7) 70.4 (68.5, 72.1) 51,100 (47,800, 54,400) Monash University 50.6 (48.7, 52.6) 58.6 (57.0, 60.2) 70.9 (69.6, 72.1) 50,500 (48,800, 52,200) Murdoch University 49.8 (44.3, 55.2) 69.5 (64.7, 73.9) 91.6 (88.5, 93.9) 56,500 (53,900, 59,100) Queensland University of Technology 42.1 (39.3, 45.1) 61.2 (58.9, 63.4) 78.0 (76.3, 79.5) 54,800 (52,500, 57,000) RMIT University 42.9 (40.4, 45.4) 58.0 (55.9, 60.0) 72.8 (71.2, 74.3) 50,800 (48,900, 52,700) Southern Cross University 34.6 (29.4, 40.3) 70.6 (66.4, 74.4) 81.9 (78.7, 84.6) 49,600 (47,000, 52,200) Swinburne University of Technology 38.0 (34.4, 41.7) 60.0 (57.1, 62.9) 78.0 (75.7, 80.0) 52,200 (50,500, 53,800) The Australian National University 50.3 (45.8, 54.9) 59.8 (56.2, 63.3) 65.8 (63.1, 68.4) 58,400 (52,700, 64,000) The University of Adelaide 42.1 (39.3, 44.9) 54.6 (52.2, 57.0) 73.5 (71.8, 75.1) 59,500 (55,700, 63,300) The University of Melbourne 43.9 (41.8, 46.1) 52.3 (50.7, 54.0) 66.2 (65.0, 67.4) 50,000 (48,600, 51,500) The University of Queensland 55.0 (52.9, 57.2) 63.5 (61.7, 65.3) 79.5 (78.2, 80.8) 55,000 (53,300, 56,700) The University of South Australia 36.7 (33.8, 39.8) 61.1 (58.4, 63.7) 82.5 (80.6, 84.2) 50,700 (47,600, 53,700) The University of Sydney 54.6 (52.0, 57.1) 60.3 (58.2, 62.4) 73.3 (71.7, 74.8) 57,000 (54,600, 59,400) The University of Western Australia 41.7 (36.7, 46.8) 51.2 (47.2, 55.2) 69.1 (66.0, 72.0) 52,000 (46,000, 58,000) 2021 GOS International Report 12
University Full-time employment (%) Overall employed (%) Labour force participation Median salary, employed rate (%) full-time ($) Torrens University 54.7 (51.4, 57.9) 78.4 (76.1, 80.5) 89.5 (87.8, 90.9) 52,200 (50,600, 53,800) University of Canberra 44.0 (39.3, 48.7) 68.7 (65.0, 72.1) 82.2 (79.4, 84.6) 52,900 (48,200, 57,600) University of Divinity n/a n/a 50.0 (40.2, 59.8) n/a University of New England 57.1 (45.2, 68.2) 73.1 (62.7, 81.2) 75.4 (66.8, 82.0) n/a University of New South Wales 50.3 (47.4, 53.1) 60.1 (57.7, 62.5) 78.7 (76.9, 80.3) 60,000 (56,000, 64,000) University of Newcastle 49.8 (44.7, 54.9) 65.4 (61.1, 69.4) 75.7 (72.4, 78.7) 66,600 (62,900, 70,300) University of Southern Queensland 47.3 (41.2, 53.6) 75.2 (69.9, 79.5) 93.5 (90.0, 95.5) 54,000 (49,400, 58,600) University of Tasmania 39.3 (35.8, 43.0) 58.1 (54.9, 61.3) 81.6 (79.2, 83.7) 58,000 (52,300, 63,700) University of Technology Sydney 41.2 (38.9, 43.6) 59.1 (57.1, 61.1) 79.5 (78.1, 80.9) 52,600 (50,600, 54,600) University of the Sunshine Coast 43.3 (39.7, 47.0) 74.0 (71.2, 76.6) 89.0 (87.1, 90.6) 50,100 (47,500, 52,700) University of Wollongong 45.5 (41.1, 49.9) 61.7 (57.8, 65.4) 79.2 (76.2, 81.8) 55,000 (49,600, 60,400) Victoria University 41.1 (37.7, 44.7) 69.9 (67.0, 72.6) 85.1 (83.0, 87.0) 48,000 (44,400, 51,600) Western Sydney University 42.0 (39.0, 44.9) 69.1 (66.8, 71.3) 89.3 (87.8, 90.6) 54,300 (51,500, 57,000) All Universities 45.2 (44.6, 45.7) 62.9 (62.5, 63.4) 77.8 (77.5, 78.2) 53,500 (52,700, 54,300) Standard deviation 6.5 8.4 10.1 6,700 Note: Median salary figures only include data for international graduates working in Australia. 2021 GOS International Report 13
Figure 3 Undergraduate full-time employment rates by university, international graduates, 2019-2021 (%) 80.0% 70.0% 60.0% 50.0% 40.0% 30.0% 20.0% 10.0% 0.0% y y y y y y y a y yy y y y y y y y y y ee d y a y d s e d t g y y t t t ty i t t t t t g t t iae i t ra e l iaeys t iti i i i itititl ititii i i i i g itidrnnl l i r n l t nn a n iti s s s s s s s s ss si o s s o s a a a n a e a a s a n o s r r rsr r r r rar rr rsrsr rsl r r l r lu l r d r rs l a la d o g r rs e e ere e e e e t e ee e e e e e e o e eo s t t e b g c s C e e v v v v s v v v v v nov v n db s y s v n n W m y v iv i i i ivivivu ivivii i i i h i i h iv l enu Su i a h w s Se onivi n nin n n n n n n nn n c n c n Aee Af A C Et e eenayinl n A e e f u o u N uT ol U U U U U U Uy U U U Un Un U Un U U h Unfw o g h U Un t U t l o M t y rn e f f o s d n n i s h e e h TT Uns T f Q t s o S Q l W y ic i r inin r b sh f I s f a y f u i e y o o n iae l ndn t k a e it ri c n it o o s t n t N ny o u r o o a tur a w rsd fook a a o oM ro o sy o r s e i f w y n ofon l rw e if ro y y t y s o e iterit S t h B s Su e o C u n t R t iori Se e rr s h y d t a v r T o rdi Ci t t f v r y N s h e t y a s C D C i in s q es i i e r tr i ic en De l Ge a c M u s a ivrs o WTov itf e ue ech s V S l h F r rnrs e r f t r C e s r L a M e N y i s o o T n e it Un m e e nv e it o r iv ivf f e rn u a d n a M v h v n i v s Uny e y Sno ov ia rlh J t i U i r e t Un itn f i e l Qa E o ni iae n i iv U U y t l C i u l e s o y n s a a h t U o Una h Un Ths n r t it e r r r e iv r e y i s U t t C ra S e t T e U e U t s r s e s n v iv i e W u en d nd rnu Thh i n s er a T U v iv A C e l u A e U er i n F b h Un v n ns n e T e i U U e i h n e w T Th U u S Q 2021 GOS International Report 14
Figure 4 Undergraduate median full-time salaries by university, international graduates, 2019-2021 ($) 75,000 70,000 65,000 60,000 55,000 50,000 45,000 40,000 35,000 30,000 y y y y y y a y y y y y y y y y y y y e e d y a y s e d t g y y t t ty i t t t t t g t t ia e i t ra e l ia ey s t it i i i it it it l it it i i i i i i g it id rn n l l i r l t n n a n it i s s s s s s s s s si o s s o s a a a n a e a s a n o s r rs r r r r ra r r r rs rs r rs l r r l r l u l r d r rs a l a d o g r rs e er e e e e e t e e e e e e e e e o e e o s t t e b c s C e e v v v s v v v v v no v v n d b s y s v n W m y v iv i i i iv iv iv u iv iv i i i i i h i i h iv l en u S u i a h w s S e on iv i n n n n n n n n n n n c n c n A e e A f A C t e een a y in l n A e e f u o u N u T ol U U U U U U y U U U Un Un U Un U U h Un f o g h U Un t U t l o M t y rn f f o s d n n i s h e e h T T Uns T f Q t s o S Q l W y ic i r in in r b sh f I s f a y f u i e y o o n ia e l n t k a rs e it ri c o n it o o s t n t y n y o u r o a tu r a w e d f ook a a o o M ro s y o r s e i w n of o n h l rw u if C ro u n y y io r t y S e e rr s e it er it h S y t d t s a S e o v r T o rd t R C t t i t f r s h s e t s C i in s q i i e s i v N t r i ic y a D C l G u s a r i e r en D e e a c M iv s o W To v f e u e ec h s V S l h F r rn rs e r f t r C e s r L a M e N y i o o T n e it Un m e e n v e it o iv iv f f e rn u a d n a M v h v n i v s Un y y S n o o v ia rl h J t i U i r e t Un it n f i e l Q a E o ni ia e n i U U y t l C i u l e s o y n s a a h t U o Un a h Un Th s r t it e r r r e iv r e y i s U t t C ra S e t T e U e t s r s e s n v iv i e W u en d nd rn u Th h i n s er a T U v iv A C e l u A e U er i n F b h Un v n ns n e T e i U U e i h n e w T Th U u S Q Note: Median salary figures only include data for international graduates working in Australia. 2021 GOS International Report 15
2.4.2 NUHEIs International undergraduate employment outcomes for non-university higher education institutions (NUHEIs) are shown in Table 9 and Figure 3. As for universities, data has been pooled for the years 2019, 2020 and 2021. Institutions are only shown where at least one indicator is reportable. Even when three years of data are pooled there are insufficient records available to report median salaries for many NUHEIs. Using this three-year aggregation, several NUHEIs have full-time international undergraduate employment rates over 70 per cent, including Alphacrucis College, 74.3 per cent, SP Jain School of Management, 73.7 per cent, Le Cordon Bleu Australia, 73.0 per cent, TAFE Queensland, 71.0 per cent, and International College of Hotel Management, 70.5 per cent. NUHEIs with high median full-time international undergraduate salaries include TAFE NSW, $58,400, Academy of Information Technology, $56,000, and Holmesglen Institute, $55,000. Table 9 Undergraduate employment outcomes by NUHEI, international graduates, 2019-2021 NUHEI Full-time employment (%) Overall employed (%) Labour force participation Median salary, employed rate (%) full-time ($) Academies Australasia Polytechnic Pty 20.0 (11.5, 32.3) 70.4 (59.3, 79.5) 90.0 (81.6, 95.0) n/a Limited Academy of Information Technology 49.4 (41.5, 57.4) 71.3 (64.5, 77.0) 89.3 (84.3, 92.5) 56,000 (48,700, 63,300) Alphacrucis College 74.3 (61.3, 83.8) 87.5 (79.0, 92.6) 90.3 (82.8, 94.5) n/a Asia Pacific International College 28.9 (19.2, 41.0) 75.0 (64.0, 83.5) 92.9 (84.7, 97.1) n/a Australian Institute of Higher Education 20.3 (13.4, 29.4) 71.6 (63.1, 78.8) 88.9 (82.5, 93.2) n/a Avondale University College n/a 82.1 (70.9, 87.7) 96.6 (87.3, 97.8) n/a Box Hill Institute n/a 67.6 (55.7, 77.0) 97.1 (88.4, 99.1) n/a CIC Higher Education 25.9 (17.4, 36.8) 65.3 (55.9, 73.7) 91.5 (84.8, 95.5) n/a Holmes Institute 31.0 (26.8, 35.6) 66.6 (62.7, 70.2) 89.2 (86.6, 91.3) 44,000 (41,000, 47,000) Holmesglen Institute 52.7 (47.3, 58.1) 82.7 (78.6, 85.8) 96.1 (93.6, 97.4) 55,000 (51,700, 58,300) International College of Hotel Management 70.5 (62.0, 77.2) 89.9 (84.3, 92.8) 92.9 (88.1, 95.1) n/a International College of Management, Sydney 55.0 (45.2, 64.4) 74.7 (67.1, 80.8) 78.4 (72.1, 83.3) n/a Kaplan Business School 43.9 (39.3, 48.7) 75.9 (72.3, 79.0) 87.5 (84.8, 89.6) 52,200 (48,100, 56,300) Kaplan Higher Education Pty Ltd n/a n/a 62.9 (51.3, 72.5) Kent Institute Australia 42.5 (37.8, 47.4) 69.8 (65.7, 73.5) 93.7 (91.2, 95.3) 47,000 (43,200, 50,700) King's Own Institute 42.3 (38.7, 45.9) 72.0 (69.1, 74.7) 94.2 (92.5, 95.3) 49,100 (46,400, 51,800) Le Cordon Bleu Australia 73.0 (64.3, 79.9) 86.7 (80.0, 90.8) 93.8 (88.4, 96.2) 49,800 (46,000, 53,500) 2021 GOS International Report 16
NUHEI Full-time employment (%) Overall employed (%) Labour force participation Median salary, employed rate (%) full-time ($) Melbourne Institute of Technology 36.5 (31.4, 42.0) 70.1 (65.5, 74.2) 92.9 (90.1, 94.8) 47,500 (44,900, 50,100) Melbourne Polytechnic 42.6 (37.4, 48.0) 69.6 (64.7, 73.8) 91.5 (88.4, 93.6) 50,000 (46,800, 53,200) SAE Institute 35.5 (27.1, 45.1) 67.5 (59.5, 74.4) 84.7 (78.5, 89.0) n/a SP Jain School of Management 73.7 (66.5, 79.5) 77.2 (70.5, 82.5) 93.5 (88.9, 96.0) 50,500 (47,500, 53,500) Stott's College 48.1 (38.8, 57.6) 63.4 (55.4, 70.4) 91.0 (85.2, 94.1) n/a Study Group Australia Pty Limited n/a 51.4 (38.5, 64.1) 53.8 (44.6, 62.8) n/a TAFE NSW 56.4 (49.8, 62.7) 77.8 (72.5, 82.0) 92.3 (88.6, 94.5) 58,400 (56,100, 60,800) TAFE Queensland 71.0 (59.5, 79.1) 85.3 (75.3, 90.1) 100.0 (92.6, 100.0) n/a The Australian Institute of Music n/a n/a 84.6 (72.2, 90.5) n/a Think Education 44.1 (39.7, 49.4) 79.3 (NA, NA) 86.6 (NA, NA) n/a UOW College n/a 53.3 (42.5, 63.8) 67.2 (58.7, 74.3) UTS College 14.6 (10.3, 20.4) 49.3 (45.5, 53.1) 60.3 (57.5, 63.0) n/a VIT (Victorian Institute of Technology) 42.8 (39.6, 46.1) 72.5 (69.9, 74.8) 96.4 (95.0, 97.1) 47,000 (42,400, 51,500) Wentworth Institute of Higher Education 34.0 (25.6, 44.3) 62.7 (54.9, 69.5) 89.3 (83.5, 92.4) n/a William Angliss Institute 56.3 (48.3, 63.8) 84.4 (78.3, 88.6) 90.6 (85.6, 93.5) 45,000 (40,300, 49,700) All NUHEIs 43.2 (42.0, 44.6) 70.4 (69.4, 71.4) 86.1 (85.5, 86.8) 50,000 (49,300, 50,700) Standard deviation 25.2 17.2 11.3 12,400 Note: Median salary figures only include data for international graduates working in Australia. Data in the table above is not directly comparable to the university data which is single year. 2021 GOS International Report 17
Figure 5 Undergraduate full-time employment rates by NUHEI, international graduates, 2019-2021 (%) 90.0% 80.0% 70.0% 60.0% 50.0% 40.0% 30.0% 20.0% 10.0% 0.0% y y e e n l , l a e a y c t e n e ) r e t g g g n o te te e t o i t i i te n g g y e t e io i n o l u l g n e e SW nd io g h u P o l t t tu tu ot e h a t a o tu l a t l lle l a i r l h m l l a lle o g it ic o a ti ti H c tr t t o ti N l i t n n o o c c s s m s s n ec s e o E ns c o o s C C u u n e S u ns u t n C e u C n H n h h s l d d n I of s I h y ag s d S h f I c c i I e ag s A l I AF e o e e c a E E s n g ntn e n A ec o E tt' T u E T c s t u n r r e e e e a n te w u A an k U e ten is y T r io e e l l i e T Q T o l l n t m g m s tu O l f e P S to E in tui c h h l ole M o M S f t g o o a a o s u i s B n f F ti n i ig g e Cg f t ' e r h o P h n i H l o B s t o A T s ca A d at r H m a e ey n on u l T te n u iae lp e l na ng d u o o s t f C H a g n an I i t o Id m it m A o d l t i b tu E a r n o on e K or t h th l I e CI H i M l y n s el ti ia a im o t t l e C c s r l r f ic a o S ap n M o il t L u K K e S n if n C I s In it r L e I n w W u f c t e al n ai n t o a s t r n A a n n J i e y P n o u r s m ia I I i o P W ie e s n at b S to c m A ia n el i e ad l r V c a e M ( d r t a A t T c s In I A u V A 2021 GOS International Report 18
3. Skills utilisation The proportion of graduates working in managerial and professional occupations is one measure of skills utilisation. These occupations are defined by the ABS as being commensurate with requiring bachelor level or higher qualifications. As shown in Table 10, at undergraduate and postgraduate coursework levels international graduates are less likely to be employed in 58.1% managerial and professional occupations than their domestic counterparts. For example, of undergraduates working full-time, 58.1 international undergraduates per cent of international graduates were employed at these occupation levels compared with 67.8 per cent of domestic graduates. At employed full-time in managerial postgraduate coursework level, international graduates were much less likely to be working full-time in managerial and professional or professional occupations (2021) occupations than their domestic counterparts, 55.1 per cent and 84.3 per cent respectively. At postgraduate research level, however, international graduates were slightly more likely to be employed full-time in managerial and professional occupations than were domestic graduates, 91.9 per cent in comparison with 91.8 per cent. Table 10 Graduates employed in managerial and professional occupations by employment type and study level, international and domestic graduates, 2021 (% of those employed) 31.6% Undergraduate Postgraduate coursework Postgraduate research international undergraduates International Domestic International Domestic International Domestic employed full-time indicated they were working in a job that did not Full-time employed 58.1 67.8 55.1 84.3 91.9 91.8 fully utilise their skills or education Overall employed 44.3 55.1 41.7 81.8 89.5 90.5 (2021) Graduates are also asked in the GOS to indicate whether or not they believed that they were working in a job that allowed them to fully use their skills or education. In 2021, 31.6 per cent of international undergraduates employed full-time indicated they were working in a job that did not allow them to fully use their skills or education, similar to the 29.3 per cent recorded for domestic graduates. At postgraduate coursework level the difference was greater, with 43.0 per cent of international graduates working in such jobs, compared with 28.7 per cent of domestic graduates. For postgraduate research graduates, in contrast, just 18.1 per cent of international graduates indicated their job did not fully use their skills or education, compared with 26.9 per cent of domestic graduates. For international undergraduates, the most cited reason for working in a job which did not fully use the graduate’s skills or education was ‘Do not have permanent residency’, 22.5 per cent of respondents. As a result, international undergraduates were less likely than domestic undergraduates to cite other reasons for working in a job that did not fully use their skills or education such as ‘Entry level job’, 16.5 per cent in comparison with 22.5 per cent. On the other hand, international undergraduates were more likely to cite ‘Not enough work experience’ as a factor, 15.9 per cent in comparison with 12.8 per cent. These trends were broadly similar at postgraduate coursework level. 2021 GOS International Report 19
Table 11 Main reason for working in job in 2021 that does not fully use skills and education, by study level, full- time employed international and domestic graduates, 2021 (%) Undergraduate Postgraduate coursework International Domestic International Domestic Studying 5.2 7.4 2.8 3.4 I'm satisfied with my current job 5.1 11.0 4.6 18.9 For financial reasons 5.1 5.5 5.4 5.9 Caring for children or family member 0.3 1.0 0.4 2.2 Long-term health condition or disability 0.0 0.0 0.0 0.2 Subtotal – Personal factors 15.7 25.0 13.2 30.6 No suitable jobs in my area of expertise 7.9 10.2 8.1 10.8 22.5% No suitable jobs in my local area 7.2 7.2 7.8 9.9 Considered to be too young by employers 2.0 2.0 1.5 2.3 of international Considered to be too old by employers 0.3 0.6 0.3 2.2 undergraduates Not enough work experience 15.9 12.8 16.5 9.1 working in a job No jobs with a suitable number of hours 1.5 0.8 0.8 0.9 Cannot find a job NFI 0.6 0.8 0.5 0.7 that does not fully I had to change jobs due to COVID-19 4.4 2.5 3.5 2.4 utilise their skills or Entry level job/career stepping stone 16.5 26.2 12.8 13.8 education, cited this Subtotal - Labour market factors 56.3 63.1 51.8 52.1 Do not have permanent residency 22.5 0.1 30.2 0.2 was due to not having Subtotal - Other factors 28.1 12.0 35.0 17.3 permanent residency Extent to which skills and education are not fully utilised 31.6 29.3 43.0 28.7 2021 GOS International Report 20
4. Further study Across all levels of study, international graduates are more likely to engage in further full-time study after completion of their initial Undergraduates in further degree than are domestic graduates, as shown above in Table 1. Rates of further study vary considerably by home country of the graduate, full-time study, by top 10 as shown by Table 12, Table 13 and Table 14. Among international undergraduates in the largest 10 home countries, the rate of further full- home countries, 2021 time study ranges from a high of 59.6 per cent for Chinese graduates down to 11.4 per cent for Nepalese graduates. Among postgraduate coursework graduates, Sri Lankan graduates are most likely to undertake further full-time study at 20.0 per cent and Bangladeshi graduates least likely at 9.2 per cent. Among postgraduate research graduates, Chinese graduates were most likely to undertake further full-time study at 16.0 per and Pakistani graduates least likely at 4.0 per cent. 59.6% Table 12 Undergraduates in further full-time study, by home country, 2021 (%) (China - highest) Home country In further full-time study China 59.6 Nepal 11.4 Malaysia 23.9 11.4% India 17.5 (Nepal - lowest) Vietnam 29.7 Hong Kong 28.0 Singapore 18.9 Indonesia 29.8 Sri Lanka 30.4 Philippines 29.3 All international graduates 33.7 All domestic graduates 21.1 2021 GOS International Report 21
Table 13 Postgraduate coursework graduates in further full-time study, by home country, 2021 (%) Home country In further full-time study India 14.1 China 18.1 Nepal 15.5 Indonesia 17.1 Sri Lanka 20.0 Vietnam 18.5 Pakistan 15.2 Philippines 14.5 Bangladesh 9.2 Bhutan 10.6 All international graduates 15.0 All domestic graduates 7.6 Table 14 Postgraduate research graduates in further full-time study, by home country, 2021 (%) Home country In further full-time study China 16.0 India 12.4 Vietnam 12.6 Indonesia 13.4 Bangladesh 7.1 Iran 6.7 Sri Lanka 4.2 Malaysia 9.2 Pakistan 4.0 Germany 10.2 All international graduates 11.1 All domestic graduates 6.8 2021 GOS International Report 22
Study areas with the highest proportion of international undergraduates proceeding to full-time study in 2021 included Psychology, Proportion of international 46.8 per cent, Architecture and built environment, 45.7 per cent, Science and mathematics, 45.1 per cent, Humanities, culture and social undergraduates proceeding sciences, 43.5 per cent and Law and paralegal studies, 42.2 per cent. International undergraduates who had completed degrees in study to full-time study by study areas with a strong vocational orientation tended, not surprisingly, to be less likely to proceed on to further full-time study in 2021. These area, 2021 included Rehabilitation, 8.0 per cent, Social work, 9.4 per cent, and Nursing, 11.8 per cent. Among postgraduate coursework graduates, the study areas with the highest proportion of international graduates proceeding to full-time study included Humanities, culture and social sciences, 28.9 per cent, Science and mathematics, 19.5 per cent, Psychology, 19.2 per cent, Communications, 18.0 per cent, and Business and management, 17.1 per cent. 46.8% Table 15 International graduates in further full-time study, by original study area and level, 2021 (%) (Psychology - highest) Study area Undergraduate Postgraduate coursework Science and mathematics 45.1 19.5 Computing and information systems 28.5 13.8 8.0% Engineering 33.9 11.4 Architecture and built environment 45.7 7.5 (Rehabilitation - lowest) Agriculture and environmental studies 26.6 12.1 Health services and support 32.0 10.9 Medicine 14.0 7.0 Nursing 11.8 14.7 Pharmacy 12.1 11.8 Dentistry 14.3 0.0 Veterinary science 37.5 11.4 Rehabilitation 8.0 4.5 Teacher education 28.7 15.7 Business and management 37.6 17.1 Humanities, culture and social sciences 43.5 28.9 Social work 9.4 5.4 Psychology 46.8 19.2 Law and paralegal studies 42.2 12.7 2021 GOS International Report 23
Study area Undergraduate Postgraduate coursework Creative arts 38.4 11.8 Communications 39.6 18.0 Tourism, hospitality, personal services, sport n/a 14.3 and recreation All study areas 33.7 15.0 Management and commerce was by far the most commonly chosen field for international undergraduate and postgraduate coursework In 2021, Management graduates engaged in further study, as shown in Table 16. Of those graduates in further study, 34.4 per cent of undergraduates and 31.1 per cent of postgraduate coursework graduates were enrolled in this study area. Information technology and Health were also popular further and Commerce was study options for graduates at both study levels. the most popular Table 16 Broad field of education destinations of international graduates in full-time study, by field of education level of original study, 2021 (%) Field of education Undergraduate Postgraduate coursework for further full-time Natural and Physical Sciences 4.2 3.0 study, with 34.1 per Information Technology 13.9 18.8 cent of international Engineering and Related Technologies 9.9 10.5 Architecture and Building 4.2 2.1 undergraduates Agriculture Environmental and Related Studies 1.2 1.7 enrolled in this study Health 12.5 9.8 area. Education 4.3 6.4 Management and Commerce 34.4 31.1 Society and Culture 7.3 8.4 Creative Arts 4.2 1.5 Food, Hospitality and Personal Services 2.5 3.9 Mixed field qualification 1.2 2.5 Other 0.2 0.3 All fields 100.0 100.0 2021 GOS International Report 24
Appendix 1 1.1 Methodological summary Methodology 1.1.1 Overview The in-scope population consisted of all graduates who completed the requirements of an undergraduate or postgraduate award at a participating Australian higher education institution between March 2020 and February 2021. This included international graduates living outside Australia who studied at an Australian campus. Offshore graduates who studied at a campus outside Australia were excluded from the core survey. Table 17 provides a summary of the 2021 GOS, filtered to international graduates. A total of 119,765 international graduates from 95 institutions, including all 41 universities and 54 non-university higher education institutions (NUHEIs), were approached to participate. From a final in-scope sample of 113,678 graduates, responses were received from a total of 38,188 graduates. This represents an overall response rate of 33.6 per cent for international graduates (40.4% for domestic graduates). The final international graduate response rate for the 2021 GOS (33.6 per cent) was higher than 2020 (32.3 per cent) but slightly below results for 2019 (34.7 per cent) and 2018 (33.9 per cent). For the QILT suite of surveys, ‘response rate’ is defined as completed surveys as a proportion of final sample, where final sample excludes unusable sample (e.g., no contact details), out-of-scope and opted-out. This definition of response rates differs from industry standards by treating certain non-contacts and refusals as being ineligible for the response rate calculation. Table 17 2021 GOS operational overview, international graduates 1 2020 November 2021 May 2021 Total collection Project element Universities NUHEIs Total Universities NUHEIs Total Universities NUHEIs Total Number of participating 41 51 92 41 51 92 41 54 95 institutions Number of graduates 50,455 9,556 60,011 55,369 4,385 59,754 105,824 13,941 119,765 approached Final 'in-scope' sample 48,280 8,950 57,230 52,352 4,096 56,448 100,632 13,046 113,678 Number of completed 15,925 3,175 19,100 17,404 1,684 19,088 33,329 4,859 38,188 surveys Overall response rate 33.0% 35.5% 33.4% 33.2% 41.1% 33.8% 33.1% 37.2% 33.6% Analytic unit Graduate Mode of data collection Online NB: In-scope sample excludes any approached graduates who unsubscribed, refused, had unusable contact information or were identified as out of scope during fieldwork. 2021 GOS International Report 1 Includes February supplementary round outcomes 25
1.1.2 Data collection The main collection periods were November to December 2020 and May to July 2021, with a smaller collection taking place in February to April 2021. The February collection is undertaken to accommodate institutions with August to October 2020 completions. For reporting purposes, the November and February collection period outcomes are reported together. The survey was fielded primarily online, in English only. All completing respondents were entered into a four-week rolling prize draw in each round of the 2021 GOS collection cycle. The prize pool totalled $27,000 in the November round, $37,000 in the May round, and $6,000 in the February. The total prize pools for each collection aimed to reflect the proportion of sample in each round of the collection year. A broad range of promotional materials were provided to institutions to raise awareness of the GOS and encourage participation amongst the target population. The contact strategy for the 2021 GOS featured an email invitation to complete the survey, followed by nine reminder emails, up to two SMS reminders, as well as in field telephone reminder calls. Several institutions also commissioned post-fieldwork telephone reminder calls to boost participation, which extended data collection for these institutions approximately two weeks post main collection. Refer to the 2021 GOS Methodological Report for further information on target population definition, sample design and preparation, survey design and procedures, response maximisation strategies, data preparation processes, final field outcomes and response analysis. A copy of the generic survey instrument (i.e., excluding any institution specific items) and screenshots of the survey are included in the 2021 GOS Methodological Report and a summary of items is available in Appendix 3 of this report. 1.2 Response rate by course level Table 18 provides the final response rate by course level and institution for each round of the 2021 GOS collection cycle. Postgraduate research graduates had the highest overall response rate of 63.8 per cent, followed by postgraduate coursework graduates with 33.0 per cent, and undergraduates with 32.2 per cent. Some variation by institution type for each course level can be seen, with larger differences noted for postgraduate coursework and postgraduate research graduates. Table 18 2021 GOS response rate by course level, international graduates 2 2020 November 2021 May 2021 Total collection Project element Universities NUHEIs Total Universities NUHEIs Total Universities NUHEIs Total Undergraduate 30.1% 32.5% 30.5% 33.2% 36.7% 33.6% 31.9% 34.2% 32.2% Postgraduate coursework 32.4% 37.4% 33.1% 32.0% 46.7% 32.8% 32.2% 39.7% 33.0% Postgraduate research 62.9% 0.0% 62.9% 65.4% 66.7% 65.4% 63.8% 50.0% 63.8% 2 Includes February supplementary round outcomes 2021 GOS International Report 26
1.3 Response rate by institution Table 19 shows the final response rate by institution for each round of the 2021 GOS collection cycle. There was a minor variation in response rate by provider type, with an overall response rate of 33.1 per cent for universities and 37.2 per cent for NUHEIs. At an individual institution level within provider type, the response rate ranged from 62.8 per cent to 19.5 per cent for universities, and 100.0 per cent to 0 per cent for NUHEIs. Table 19 2021 GOS university response rates (All study levels), international graduates 3 Institution 2020 November 2021 May Total collection Australian Catholic University 50.9 59.4 56.7 Bond University 33.9 35.8 34.4 Central Queensland University 35.4 27.6 32.3 Charles Darwin University 44.3 52.3 48.6 Charles Sturt University 30.8 32.5 31.5 Curtin University 32.1 40.0 36.7 Deakin University 40.3 34.2 37.6 Edith Cowan University 34.4 48.6 41.7 Federation University Australia 37.4 34.8 36.1 Flinders University 39.9 34.3 36.5 Griffith University 29.4 31.3 30.4 James Cook University 43.3 43.2 43.2 La Trobe University 36.6 28.4 32.4 Macquarie University 36.8 36.6 36.7 Monash University 27.9 27.8 27.8 Murdoch University 39.1 44.7 42.5 Queensland University of Technology 38.4 39.2 38.8 RMIT University 28.4 29.7 29.1 3 Includes February supplementary round outcomes 2021 GOS International Report 27
3 Institution 2020 November 2021 May Total collection Southern Cross University 44.9 39.9 43.3 Swinburne University of Technology 39.2 35.2 37.2 The Australian National University 21.2 20.6 20.9 The University of Adelaide 42.6 42.2 42.4 The University of Melbourne 38.8 35.5 36.9 The University of Notre Dame Australia 62.2 63.2 62.8 The University of Queensland 29.4 25.6 27.3 The University of South Australia 38.9 43.0 41.5 The University of Sydney 24.5 27.9 26.2 The University of Western Australia 29.9 29.8 29.9 Torrens University 40.1 51.2 44.3 University of Canberra 39.6 39.2 39.4 University of Divinity 52.9 50.0 50.9 University of New England 40.9 59.6 44.0 University of New South Wales 18.4 20.6 19.5 University of Newcastle 25.0 32.3 29.0 University of Southern Queensland 47.6 42.1 44.5 University of Tasmania 42.5 40.3 41.2 University of Technology Sydney 30.1 34.8 32.7 University of the Sunshine Coast 51.4 54.1 52.4 University of Wollongong 36.9 28.4 31.5 Victoria University 33.7 41.5 36.7 Western Sydney University 36.2 40.4 38.9 All Universities 33.0 33.2 33.1 2021 GOS International Report 28
Table 20 2021 GOS NUHEI response rates (All study levels), international graduates 4 Institution 2020 November 2021 May Total collection Academies Australasia Polytechnic Pty Limited 33.8 40.9 34.7 Academy of Information Technology 40.2 41.4 40.5 ACAP and NCPS 45.5 45.5 Alphacrucis College 45.8 30.8 34.8 Asia Pacific International College 35.2 23.8 33.2 Australian Academy of Music and Performing Arts <0.1% <0.1% Australian College of Nursing 42.4 41.9 42.2 Australian College of Theology Limited 41.7 50.0 45.0 Australian Institute of Business Pty Ltd 66.7 80.0 75.0 Australian Institute of Higher Education 31.8 56.4 39.4 Australian Institute of Management Education & 50.0 50.0 Training Avondale University College 100.0 57.7 60.7 Box Hill Institute 27.8 45.5 37.5 Chisholm Institute 46.9 46.9 Christian Heritage College 33.3 33.3 CIC Higher Education 44.1 36.7 41.8 Collarts (Australian College of the Arts) 20.0 20.0 Elite Education Institute 18.8 33.3 19.6 Endeavour College of Natural Health 27.3 27.3 Engineering Institute of Technology <0.1% 66.7 50.0 Excelsia College 63.6 37.9 45.0 Governance Institute of Australia 50.0 50.0 Holmes Institute 34.1 31.6 34.1 Holmesglen Institute 35.6 37.2 36.7 4 Includes February supplementary round outcomes 2021 GOS International Report 29
4 Institution 2020 November 2021 May Total collection Ikon Institute of Australia 100.0 100.0 Institute of Health & Management Pty Ltd 21.9 51.3 34.3 International College of Hotel Management 44.4 44.4 International College of Management, Sydney 29.6 27.9 28.9 Kaplan Business School 40.0 40.9 40.4 Kaplan Higher Education Pty Ltd 27.8 54.5 34.0 Kent Institute Australia 33.3 33.8 33.5 King's Own Institute 36.3 37.6 36.7 LCI Melbourne 100.0 100.0 Le Cordon Bleu Australia 24.4 25.0 24.7 Leo Cussen Centre for Law 66.7 66.7 66.7 Macleay College 55.6 55.6 Melbourne Institute of Technology 28.4 33.3 30.3 Melbourne Polytechnic 36.7 42.2 39.9 Moore Theological College 100.0 100.0 Nan Tien Institute 42.9 <0.1% 40.0 Ozford Institute of Higher Education 30.0 18.8 23.1 Perth Bible College 100.0 100.0 Photography Studies College (Melbourne) 40.0 40.0 Polytechnic Institute Australia Pty Ltd 42.9 58.3 46.8 SAE Institute 25.0 45.6 40.3 SP Jain School of Management 38.1 38.1 Stott's College 33.9 29.3 31.7 Study Group Australia Pty Limited 26.7 25.0 26.1 TAFE NSW 24.1 28.8 26.9 TAFE Queensland 47.6 81.8 59.4 TAFE South Australia 25.0 23.1 24.1 2021 GOS International Report 30
4 Institution 2020 November 2021 May Total collection The Australian College of Physical Education 33.3 33.3 The Australian Institute of Music 42.9 42.9 The Cairnmillar Institute 80.0 80.0 The College of Law Limited 29.7 38.3 32.4 The Institute of International Studies (TIIS) 8.3 8.3 Think Education 100.0 66.7 80.0 UOW College 37.9 33.3 35.1 UTS College 20.1 21.6 20.8 VIT (Victorian Institute of Technology) 75.7 76.5 76.2 Wentworth Institute of Higher Education 56.3 47.1 50.6 Whitehouse Institute of Design, Australia 50.0 50.0 William Angliss Institute 31.4 34.0 32.7 All NUHEIs 35.5 41.1 37.2 NB: A blank cell denotes that the institution did not participate in that GOS collection 1.4 Data representativeness In terms of Total Survey Error, response rates are less important than the representativeness of the respondent profile. To investigate the extent to which those who responded to the GOS are representative of the in-scope population, respondent characteristics are presented alongside population parameters in Table 21 and Table 22 below. Some groups in the achieved sample are represented broadly in-line with their sample proportion, with mode of attendance and disability status particularly well-matched for both undergraduate and postgraduate coursework graduates. The largest potential source of non-response bias is in relation to home country, main language spoken at home, and age for international graduates. Chinese graduates are under-represented in the responding sample by 15.2 percentage points. There was good representation across all other home countries that make up the top ten home countries for international graduates. Graduates who speak a language other than English at home were also less likely to respond, with those who speak a language other than English under-represented in the responding sample by 4.2 percentage points, relative to population parameters. Graduates aged thirty years or below were also under-represented by 5.3 percentage points. 2021 GOS International Report 31
Male students were slightly under-represented by 1.1 percentage points. The under-representation of Chinese graduates, those who speak a language other than English at home, and young graduates in 2021 suggests that these should be considered as areas for renewed response maximisation focus in 2022. Table 21 2021 International GOS response characteristics and population parameters by subgroup* In-scope sample (n) In-scope sample (%) Respondents (n) Respondents (%) 5 Base 113,678 100.0 38,188 100.0 Level Undergraduate 41,620 36.6 13,392 35.1 Postgraduate coursework 68,643 60.4 22,618 59.2 Postgraduate research 3,415 3.0 2,178 5.7 Gender Male 56,398 49.7 18,514 48.6 Female 57,045 50.3 19,605 51.4 Age 30 years or under 103,168 90.8 32,643 85.5 Over 30 years 10,510 9.2 5,545 14.5 Home country India 20,856 18.3 8,523 22.3 China 44,078 38.8 9,005 23.6 Nepal 8,392 7.4 3,451 9.0 Indonesia 2,968 2.6 1,187 3.1 Sri Lanka 2,512 2.2 1,049 2.7 Vietnam 3,435 3.0 1,316 3.4 Pakistan 1,919 1.7 701 1.8 Philippines 1,434 1.3 807 2.1 5 Components may not sum to base number, as records with unknown characteristics are not included in the sub-categories. 2021 GOS International Report 32
In-scope sample (n) In-scope sample (%) Respondents (n) Respondents (%) Bangladesh 1,314 1.2 608 1.6 Bhutan 622 0.5 317 0.8 Main language spoken at home English 37,341 32.8 14,113 37.0 Language other than English 76,337 67.2 24,075 63.0 Disability Disability reported 3,188 2.8 1,217 3.2 No disability reported 110,272 97.2 36,910 96.8 Mode of attendance code** Internal/Multi Mode 109,911 96.9 37,260 97.7 External/Distance 3,555 3.1 871 2.3 *Some subgroups many not add to 100 per cent due to missing data. ** Institutions took different approaches in reporting students’ mode of attendance in 2020 with only a small number updating the mode of study to reflect the shift to online, therefore the figures presented here most likely reflect students’ intentions rather than their actual mode of study in 2020. As shown in Table 22 below, the achieved international graduate respondent profile in the 2021 GOS closely matches the in-scope survey population in most study areas. Study areas with the strongest representation in the 2021 GOS were Science and mathematics, Nursing, and Computing and information systems. Business and management continues to be the most under-represented study area, followed by Communications and Creative arts. Future collections will consider trialling tailored email content for graduates from these under-performing study areas and seek increased institutional engagement at the faculty level prior to graduation. 2021 GOS International Report 33
Table 22 2021 GOS population parameters by study area and response characteristics, international graduates In-scope sample (n) In-scope sample (%) Respondents (n) Respondents (%) Science and mathematics 5,510 4.8 2,490 6.5 Computing and Information Systems 19,030 16.7 6,823 17.9 Engineering 11,327 10.0 4,094 10.7 Architecture and built environment 3,594 3.2 1,235 3.2 Agriculture and environmental studies 1,074 0.9 507 1.3 Health services and support 2,566 2.3 1,259 3.3 Medicine 849 0.7 355 0.9 Nursing 4,814 4.2 2,263 5.9 Pharmacy 345 0.3 155 0.4 Dentistry 165 0.1 70 0.2 Veterinary science 165 0.1 89 0.2 Rehabilitation 409 0.4 182 0.5 Teacher education 2,667 2.3 1,173 3.1 Business and management 49,547 43.6 13,363 35.0 Humanities, culture and social sciences 4,174 3.7 1,623 4.3 Social work 1,015 0.9 500 1.3 Psychology 554 0.5 251 0.7 Law and paralegal studies 1,552 1.4 569 1.5 Creative arts 1,831 1.6 519 1.4 Communications 2,154 1.9 601 1.6 Tourism, hospitality, personal services, sport and 336 0.3 67 0.2 recreation Total 113,678 100.0 38,188 100.0 2021 GOS International Report 34
The 2021 GOS uses labour force definitions which conform to the conceptual framework of the standard labour force Appendix 2 statistics model used by the ABS. These are presented in Table 23 below. Labour market Table 23 2021 GOS population parameters by study area and response characteristics and graduate Indicator/element Definition Graduates who were usually or actually in paid employment for one or satisfaction Employed more hours in the week before the survey (including full-time, part-time or casual employment) definitions Employed full-time Graduates who were usually or actually in paid employment for at least 35 hours per week, in the week before the survey Available for employment Graduates who were employed, looking for employment or waiting to start a job in the week prior to the survey. Available for full-time employment Graduates who were employed full-time or looking for full-time employment in the week prior to the survey. Graduates who were usually or actually in paid employment for fewer than Underemployed 35 hours per week, in the week before the survey, and who would prefer to work a greater number of hours. Overall employment rate Employed graduates (including in full-time, part-time or casual employment), as a proportion of those available for employment. Full-time employment rate Graduates employed full-time, as a proportion of those available for full- time work. Labour force participation rate Graduates available for employment, as a proportion of all graduates. Median salary The median annual salary of graduates employed full-time. Full-time study rate Graduates who reported being in full-time study, as a proportion of all graduates. Undergraduate and Postgraduate The proportion of graduates who ‘agreed’ or ‘strongly agreed’ that they were satisfaction – overall satisfaction satisfied with the overall quality of their course. indicator 2021 GOS International Report 35
Postgraduate Research graduate satisfaction, overall satisfaction indicator as well as scales on Calculated from multiple survey items, representing the proportion of intellectual climate, infrastructure, graduates who gave a positive response to items associated with each goals and expectations, scale. supervision, skills development, thesis examination and industry and external engagement Examples of graduate labour market outcomes Amy works 37 hours a week. Amy is both available for employment and available for full-time employment, as well as both employed and employed full-time. Graduate Amy is counted towards the labour force participation rate. Amy’s usual salary is counted towards the median salary figure. Bryan works 20 hours a week while also studying full-time and does not want to work additional hours. Bryan is available for employment and employed but is not available for full-time work or employed full-time. Bryan is counted towards both the full-time study rate, overall employed and the labour force participation rate. Bryan’s salary is not counted towards the median salary figure. Bryan is not considered “underemployed”. Crishna works 6 hours a week but would prefer to work 40 hours per week. Crishna is both available for employment and available for full-time employment. Crishna is employed but not employed full-time and is also underemployed. Graduate Crishna is counted towards the labour force participation rate. Crishna’s salary is not counted towards the median salary figure. Dilek is studying full-time and is not working or looking for work. Dilek is not available for employment and therefore is not counted towards the labour force participation rate. However, Dilek is counted towards the full-time study rate. Emily is not working and is looking for full-time work. Emily is both available for employment and available for full-time employment. Emily is counted towards the labour force participation rate. However, Emily is neither employed nor employed full-time, and can also be referred to as unemployed. 2021 GOS International Report 36
Appendix 3 3.1 Core questionnaire A summary of all items included in the 2021 GOS core instrument are provided in Table 24 below. A copy of the core survey GOS instrument (i.e. excluding any institution specific items) and screenshots of the survey are included in the 2021 GOS Methodological Report. questionnaire Table 24 Item summary Question ID Question Response scale Module A: Screening and confirmation Module B: Labour force PREWORKED Next we would like to understand what you are currently doing in terms of work and study. A number of questions may seem similar, however these items are based on the Australian Bureau of Statistics (ABS) Labour Force Survey. Using the ABS approach means the information you provide is more robust and able to be compared to national employment statistics. WORKED Thinking about last week, the week starting , 1. Yes and ending last , . 5. No 6. Permanently unable to work 7. Permanently not intending to work *(DISPLAY IF AGE>64) Last week, did At any time during the last 4 weeks have you been looking 1. Yes you do any for full-time work? 5. No work at all in a job, business or 6. Permanently not farm? intending to work *(DISPLAY IF AGE>64) WWOPAY Last week, did you do any work without pay in a family 1. Yes business? 5. No 6. Permanently not intending to work *(DISPLAY IF AGE>64) AWAYWORK Did you have a job, business or farm that you were away 1. Yes from because of holidays, sickness or any other reason? 5. No 6. Permanently not intending to work *(DISPLAY IF AGE>64) 2021 GOS International Report 37
Question ID Item label Response scale LOOKFTWK At any time during the last 4 weeks have you been looking for full-time work? 1. Yes 5. No 6. Permanently not intending to work *(DISPLAY IF AGE>64) LOOKPTWK Have you been looking for part-time work at any time during the last 4 weeks? 1. Yes 5. No 6. Permanently not intending to work *(DISPLAY IF AGE>64) BEGNLOOK When did you begin looking for work? 1. Enter month 2. Enter year (NUMERIC RANGE 1960 – 2020) STARTWK If you had found a job, could you have started last week? 1. Yes 5. No STARTWKFU Why do you say you couldn't have started last week? 1. Because of the current situation with COVID-19 5. Some other reason WAITWORK You mentioned that you didn’t look for work during the last 4 weeks. Was that because you were waiting to start 1. Yes work you had already obtained? 5. No MORE1JOB Did you have more than 1 job or business last week? 1. Yes 5. No INTROSELFEMPii The next few questions are about the job or business in which you usually work the most hours, that is, your main job. INTROSELFEMPiii The next few questions are about the job or business in which you usually work the most hours, that is, your main job. SELFEMP Did you work for an employer, or in your own business? 1. Employer 2. Own business (go to ACTLHRSM) 3. Other or uncertain PAYMENT Are you paid a wage or salary, or some other form of payment? 1. Wage or Salary 5. Other or Uncertain 2021 GOS International Report 38
Question ID Item label Response scale PAYARRNG What are your arrangements? 10. Unpaid voluntary work *(GO TO MODULE C) 11. Unpaid trainee or work placement *(GO TO MODULE C) 12. Contractor or Subcontractor 13. Own business or Partnership 14. Commission only 15. Commission with retainer 16. In a family business without pay *(GO TO MODULE C) 17. Payment in kind 18. Paid by the piece or item produced 19. Wage or salary earner 20. Other (Specify) ACTLHRSM How many hours did you actually work in your main job last week less time off but counting any extra hours 1. Enter hours (NUMERIC, RANGE 0-168) worked]? USLHRSM How many hours do you usually work each week in your main job? 1. Enter hours (NUMERIC, RANGE 0-168) ACTLHRS How many hours did you actually work in all your jobs last week less time off but counting any extra hours 1. Enter hours (NUMERIC, RANGE 0-168) worked (or): ? USLHRS How many hours do you usually work each week (or): ? 1. Enter hours (NUMERIC, RANGE 0-168) PREFMHRS Would you prefer to work more hours than you usually work (or): ? 1. Yes 5 No 6. Don’t know PREFHRS How many hours a week would you like to work? 1. Enter hours (NUMERIC, RANGE 0-168, CAN’T BE LESS THAN USLHRS AVLMHRS Last week, were you available to work more hours than you usually work? 1. Yes 2. No 2021 GOS International Report 39
Question ID Item label Response scale RSNOMORE You mentioned that you are not looking to work more hours. What is the main reason you work the number of 1. No suitable job in my local area hours you are currently working? Please select only one answer. 2. No job with a suitable number of hours 3. No suitable job in my area of expertise 7. Long-term health condition or disability 8. Caring for family member with a health condition or disability 9. Caring for children 10. Studying 12. I’m satisfied with the number of hours I work 13. No more hours available in current position 14. Work has been reduced/shutdown due to COVID-19 15. Due to contract restrictions 16. Pursuing other interests/commitments in spare time 11. Other (Please specify) RSMORE You mentioned that you are looking to work more hours. What is the main reason you work the number of 1. No suitable job in my local area hours you are currently working? Please select only one answer. 2. No job with a suitable number of hours 3. No suitable job in my area of expertise 4. Considered to be too young by employers 5. Considered to be too old by employers 9. Caring for children 10. Studying 12. No more hours available in current position 13. Work has been reduced/shutdown due to COVID-19 14. Financial reasons 15. Due to visa restrictions/waiting for permanent residency 11. Other (Please specify) OCC What is your occupation in your ? 1. Enter occupation 2021 GOS International Report 40
Question ID Item label Response scale DUTIES What are your main tasks and duties? 1. Enter main tasks and duties INDUSTRY What kind of business or service is carried out by your ? 1. Enter business or service EMPLOYER What is the name of your ? 1. Enter employer/business name SECTOR In what sector are you wholly or mainly employed? 1. Public or government 2. Private 3. Not-for-profit INAUST Are you working in Australia? 1. Yes 2. No 3. Not sure EMPSTATE In which state or territory is your currently located? 1. NSW 2. VIC 3. QLD 4. SA 5. WA 6. TAS 7. NT 8. ACT 98. Don’t know LOCATION And what is the postcode of your ? 1. Enter postcode or suburb *PROGRAMMER NOTE USE POSTCODE LOOKUP LIST 2. Not sure 2021 GOS International Report 41
Question ID Item label Response scale COUNTRYx In which country is your based? 1. Bangladesh 2. Canada 3. China (excludes SARs and Taiwan) 4. Hong Kong (SAR of China) 5. India 6. Indonesia 7. Malaysia 8. New Zealand 9. Saudi Arabia 10. Singapore 11. South Africa 12. South Korea 13. Sri Lanka 14. Taiwan 15. Thailand 16. United States of America 17. Vietnam 19. Macau (SAR of China) 18. Other (Please specify) CURCOUNTRY Do you currently live in Australia or Overseas? 1. Australia 2. Overseas CURSTATE In which state or territory do you usually live? 1. NSW 2. VIC 3. QLD 4. SA 5. WA 6. TAS 7. NT 8. ACT 98. Don’t know 2021 GOS International Report 42
Question ID Item label Response scale CURPCODE What is the postcode or suburb where you usually live? 1. *PROGRAMMER NOTE USE POSTCODE LOOKUP LIST 2. Not sure OSCOUNTRY In which country do you currently live? 1. *PROGRAMMER NOTE: USE GO8 COUNTRY LIST EMP12 Have you worked for 12 months or more? 1. Yes, more than 12 months 5. No, less than 12 months EMPMTHS How many months have you worked ? 1. Enter number of months (NUMERIC, RANGE 1-12) EMPYRS How many years have you worked ? 1. Enter number of years (NUMERIC, RANGE 1-49) FFTJOB Is this your first full-time job? Yes/No SALARYA In Australian dollars, how much do you usually earn in , before tax or anything else is taken out? Please make only one selection. Specify in whole dollars, (NUMERIC, RANGE 1-250) excluding spaces, commas, dollar sign ($). 2. Amount per day (Please specify) (NUMERIC, RANGE 1-800) 3. Amount each week (Please specify) (NUMERIC, RANGE 1-4000) 4. Amount each fortnight (Please specify) (NUMERIC, RANGE 1-8000) 5. Amount each month (Please specify) (NUMERIC, RANGE 1-17,500) 6. Amount each year (Please specify) (NUMERIC, RANGE 1-250K) 7. No earnings 8. Don’t know 2021 GOS International Report 43
Question ID Item label Response scale SALARYB Sorry but the salary you entered doesn’t fit within our range. Please select the best option for how much you 1. $1 - $9,999 would usually earn in < IF MORE1JOB=5: this job/ IF MORE1JOB=1: all your jobs>, per annum before tax or 2. $10,000 - $19,999 anything else was taken out? 3. $20,000 - $29,999 4. $30,000 - $39,999 5. $40,000 - $49,999 6. $50,000 - $59,999 7. $60,000 - $79,999 8. $80,000 - $99,999 9. $100,000 - $124,999 10. $125,000 - $149,999 11. $150,000 or more 12. Don't know SALARYC And in Australian dollars, how much do you usually earn in your main job, before tax or anything else is taken 1. Amount per hour (Please specify) out? Please make only one selection. (NUMERIC, RANGE 1-250) 2. Amount per day (Please specify) (NUMERIC, RANGE 1-800) 3. Amount each week (Please specify) (NUMERIC, RANGE 1-4000) 4. Amount each fortnight (Please specify) (NUMERIC, RANGE 1-8000) 5. Amount each month (Please specify) (NUMERIC, RANGE 1-17,500) 6. Amount each year (Please specify) (NUMERIC, RANGE 1-250K) 7. No earnings 8. Don’t know SALARYD Sorry but the salary you entered doesn’t fit within our range. Please select the best option for how much you 1. $1 - $9,999 would usually earn in your main job, per annum before tax or anything else was taken out? 2. $10,000 - $19,999 3. $20,000 - $29,999 4. $30,000 - $39,999 5. $40,000 - $49,999 6. $50,000 - $59,999 7. $60,000 - $79,999 8. $80,000 - $99,999 9. $100,000 - $124,999 10. $125,000 - $149,999 11. $150,000 or more 12. Don't know 2021 GOS International Report 44
Question ID Item label Response scale SALCONF1 Sorry but the salary you entered for your main job is higher than the salary you entered for all your jobs. Please 1. $1 - $9,999 select the best option for how much you would usually earn in your main job, per annum before tax or anything 2. $10,000 - $19,999 else was taken out? 3. $20,000 - $29,999 4. $30,000 - $39,999 5. $40,000 - $49,999 6. $50,000 - $59,999 7. $60,000 - $79,999 8. $80,000 - $99,999 9. $100,000 - $124,999 10. $125,000 - $149,999 11. $150,000 or more 12. Don't know SALCONF2 And which of the following would you usually earn in your all your jobs, per annum before tax or anything else 1. $1 - $9,999 was taken out? 2. $10,000 - $19,999 3. $20,000 - $29,999 4. $30,000 - $39,999 5. $40,000 - $49,999 6. $50,000 - $59,999 7. $60,000 - $79,999 8. $80,000 - $99,999 9. $100,000 - $124,999 10. $125,000 - $149,999 11. $150,000 or more 12. Don't know 2021 GOS International Report 45
Question ID Item label Response scale SALARYOS What is your gross (that is pre-tax) annual salary? You can estimate if necessary. Please select currency 1. "AUD - Australian Dollar" 2. "BDT - Bangladeshi Taka" 3. "BWP - Botswana Pula" 4. "CNY - Chinese yuan" 5. "EUR - Euro" 6. "GBP - British Pound" 7. "HKD - Hong Kong Dollar" 8. "IDR - Indonesian Rupiah" 9. "INR - Indian Rupee" 10. "KES - Kenyan Shilling" 11. "LKR - Sri Lankan Rupee" 12. "MUR - Mauritian Rupee" 13. "MYR - Malaysian Ringgit" 14. "PKR - Pakistani Rupee" 15. "SGD - Singapore Dollar" 16. "USD - US Dollar" 17. "ZAR - South African Rand" 18. "ZMK - Zambian Kwacha" 19. "ZWD - Zimbabwean Dollar" 20. "NZD - New Zealand Dollar", 21. "CAD - Canadian Dollar", 22. "JPY - Japanese Yen", 23. "KRW - South Korean Won", 24. "VND - Vietnamese Dong", 25. "SEK - Swedish Krona", 26. "THB - Thai Baht" 27. Other (Please specify) 2021 GOS International Report 46
Question ID Item label Response scale FINDJOB How did you first find out about this job? 1. University or college careers service 2. Careers fair or information session 3. Other university or college source (such as faculties or lecturers or student society) 4. Advertisement in a newspaper or other print media 5. Advertisement on the internet (e.g. Seek, CareerOne, Ethical Jobs) 6. Via resume posted on the internet 7. Family or friends 8. Approached employer directly 9. Approached by an employer 10. Employment agency 11. Work contacts or networks 12. Social media (e.g. LinkedIn) 17. An employer promotional event 13. Other (Please specify) SPOQ The following statements are about your skills, abilities and education. 1. Strongly disagree Please indicate the extent to which you strongly disagree, disagree, neither disagree nor agree, agree or 2. Disagree strongly agree with each of these statements. 3. Neither disagree nor agree (STATEMENTS) 4. Agree a) My job requires less education than I have 5. Strongly agree b) I have more job skills than are required for this job c) Someone with less education than myself could perform well on my job d) My previous training is being fully utilised on this job e) I have more knowledge than I need in order to do my job f) My education level is above the level required to do my job g) Someone with less work experience than myself could do my job just as well h) I have more abilities than I need in order to do my job 2021 GOS International Report 47
Question ID Item label Response scale RSOVRQ Your previous responses indicated that you have more skills or education than are needed to do your current 1. No suitable jobs in my local area job. What is the main reason you are working in a job that doesn’t use all of your skills or education? Please 2. No jobs with a suitable number of hours select only one answer. 3. No suitable jobs in my area of expertise 4. Considered to be too young by employers 5. Considered to be too old by employers 9. Caring for children 10. Studying 12. I’m satisfied with my current job 13. I had to change jobs due to COVID-19 14. Not enough work experience 15. Entry level job/career stepping stone 16. Changing jobs/Careers 17. Do not have permanent residency 18. For financial reasons 11. Other (Please specify) Module C: Further study FURSTUD Are you currently a full-time or part-time student at a TAFE, university or other educational institution? 1. Yes – full-time 2. Yes – part-time 5. No FURNEW Are you currently studying in a new course after completing your ? 1. Yes 2. No FURQUAL What is the full title of the qualification you are currently studying? 1. FURFOE What is your major field of education for this qualification? 1. Natural and Physical Sciences 2. Information Technology 3. Engineering and Related Technologies 4. Architecture and Building 5. Agriculture Environmental and Related Studies 6. Health 7. Education 8. Management and Commerce 9. Society and Culture 10. Creative Arts 11. Food, Hospitality and Personal Services 12. Mixed field qualification 13. Other (Please specify) 2021 GOS International Report 48
Question ID Item label Response scale FURLEV What is the level of this qualification? 1. Higher Doctorate 2. Doctorate by Research 3. Doctorate by Coursework 4. Master Degree by Research 5. Master Degree by Coursework 6. Graduate Diploma 7. Graduate Certificate 8. Bachelor (Honours) Degree 9. Bachelor (Pass) Degree 10. Advanced Diploma 11. Associate Degree 12. Diploma 13. Non-award course 14. Bridging and Enabling course 15. Certificate I-IV FURINST And the institution where you are currently studying? 1. USE FURINST LOOKUP LIST Module D2: OVERALL SATISFACTION/PREQ CEQ Now a question regarding your . 1. Strongly disagree Please indicate the extent to which you strongly disagree, disagree, neither agree nor disagree, agree or 2. Disagree strongly agree with the following statement. 3. Neither disagree nor agree (STATEMENTS) 4. Agree ceq149 Overall, I was satisfied with the quality of this 5. Strongly agree CEQB Now thinking about your . 1. Strongly disagree Please indicate the extent to which you strongly disagree, disagree, neither agree nor disagree, agree or 2. Disagree strongly agree the following statement. 3. Neither disagree nor agree (STATEMENTS) 4. Agree ceq249 Overall, I was satisfied with the quality of this 5. Strongly agree 2021 GOS International Report 49
Question ID Item label Response scale For each of the following skills or attributes, to what extent do you agree or disagree that your • Strongly disagree from prepared you for this job? • Disagree If the skill is not required in your role, you can answer ‘Not applicable’. • Neither disagree nor agree Statements • Agree Foundation skills • Strongly agree • Oral communication skills • Not applicable • Written communication skills • Numeracy skills • Ability to develop relevant knowledge • Ability to develop relevant skills • Ability to solve problems • Ability to integrate knowledge • Ability to think independently about problems Adaptive skills and attributes • Broad general knowledge • Ability to develop innovative ideas • Ability to identify new opportunities • Ability to adapt knowledge in different contexts • Ability to apply skills in different contexts • Capacity to work independently Teamwork and interpersonal skills • Working well in a team • Getting on well with others in the workplace • Working collaboratively with colleagues to complete tasks • Understanding of different points of view • Ability to interact with co-workers from different or multicultural backgrounds Graduate Attributes CEQ/PREQ The next series of questions are about your . By we mean the major fields of education or programs of study that made up your qualification. 2021 GOS International Report 50
Question ID Item label Response scale Now a series of statements regarding your . • Strongly disagree • The staff put a lot of time into commenting on my work • Disagree • The teaching staff normally gave me helpful feedback on how I was going • Neither disagree nor agree • The helped me develop my ability to work as a team member • Agree • The teaching staff of this motivated me to do my best work • Strongly agree • The course provided me with a broad overview of my field of knowledge • Not applicable • The sharpened my analytic skills • My lecturers were extremely good at explaining things • The teaching staff worked hard to make their subjects interesting • The course developed my confidence to investigate new ideas • The developed my problem-solving skills • The staff made a real effort to understand difficulties I might be having with my work • University stimulated my enthusiasm for further learning • The improved my skills in written communication • I learned to apply principles from this course to new situations • I consider what I learned valuable for my future • As a result of my , I feel confident about tackling unfamiliar problems • My course helped me to develop the ability to plan my own work • My university experience encouraged me to value perspectives other than my own • Overall, I was satisfied with the quality of this Please tell us about your postgraduate research experience. • Strongly disagree If you have had more than one supervisor or have studied in more than one department or faculty, please • Disagree respond to the questions below in relation to your most recent supervision experience, whether by one or more • Neither disagree nor agree supervisors. • Agree Please interpret ‘thesis’ and other research-related terms in the context of your own field of education. • Strongly agree • Not applicable 2021 GOS International Report 51
Question ID Item label Response scale PREQ Please tell us about your postgraduate research experience.If you have had more than one supervisor or have 1. Strongly disagree studied in more than one department or faculty, please respond to the questions below in relation to your 2. Disagree most recent supervision experience, whether by one or more supervisors.Please interpret ‘thesis’ and other research-related terms in the context of your own field of education.Please indicate the extent to which you 3. Neither agree nor disagree strongly disagree, disagree, neither agree nor disagree, agree or strongly agree with each of these statements. 4. Agree (STATEMENTS) 5. Strongly agree preq01 Supervision was available when I needed it preq02 The thesis examination process was fair preq03 I had access to a suitable working space preq04 I developed an understanding of the standard of work expected preq29 I am confident that I can apply my skills outside the university sector preq05 The department provided opportunities for social contact with other postgraduate students preq30 I improved my ability to design and implement projects effectively preq06 My research further developed my problem solving skills preq07 My supervisor(s) made a real effort to understand difficulties I faced preq08 I had good access to the technical support I needed preq09 I was integrated into the department’s community preq10 I improved my ability to communicate information effectively to diverse audiences preq11 I understood the required standard for the thesis preq31 I had opportunities to develop professional connections outside the university sector preq12 I was able to organise good access to necessary equipment preq13 My supervisor(s) provided additional information relevant to my topic preq14 I developed my skills in critical analysis and evaluation preq15 I was satisfied with the thesis examination process preq16 The department provided opportunities for me to become involved in the broader research culture preq17 I was given good guidance in topic selection and refinement preq18 I had good access to computing facilities and services preq32 I had opportunity to work on research problems with businesses, governments, communities or organisations outside the university sector preq19 I understood the requirements of thesis examination preq33 I developed my understanding of research integrity (e.g. rigour, ethics, transparency, attributing the contribution of others) preq20 I improved my ability to plan and manage my time effectively preq21 My supervisor(s) provided helpful feedback on my progress preq22 A good seminar program for postgraduate students was provided preq23 The research environment in the department or faculty stimulated my work preq24 I received good guidance in my literature search preq34 I gained confidence in leading and influencing others preq25 The examination of my thesis was completed in a reasonable time preq26 As a result of my research, I feel confident about tackling unfamiliar problems preq27 There was appropriate financial support for research activities preq28 Overall, I was satisfied with the quality of my higher degree research experience 2021 GOS International Report 52
Question ID Item label Response scale INTROB Now, a couple of general questions about your … BESTASP What were the best aspects of your ? Please note, aspects could include things like the course content, 1. teaching or assessments. IMPROVE What aspects of your were most in need of improvement? Please note, aspects could include things 1. like the course content, teaching or assessments. Module E: Graduate preparation FORMREQ Is a or similar qualification a formal requirement for you to do your current job? 1. Yes 2. No QUALIMP To what extent is it important for you to have a , to be able to do your job? 1. Not at all important 2. Not that important 3. Fairly important 4. Important 5. Very important CRSPREP Overall, how well did your prepare you for your job? 1. Not at all 2. Not well 3. Well 4. Very well 5. Don’t know / Unsure BESTPREP What are the main ways that < E306C > prepared you for employment in your organisation? 1. IMPPREP What are the main ways could have better prepared you for employment in your organisation? 1. FSBEPREP What are the main ways that < E306C > prepared you for further study? 1. FSIMPREP What are the main ways could have better prepared you for further study? Module F: Additional items INTLINTROA And now some specifics about your *(IF STUDENTTYPE=1, DISPLAY: , IF STUDENTTYPE=2, DISPLAY: .) OSSTUDY Did you undertake any overseas study during your *(IF STUDENTTYPE=1, DISPLAY: IF 1. Yes STUDENTTYPE=2, DISPLAY: e.g. student exchange or study abroad?) 2. No 3. Not applicable 2021 GOS International Report 53
Question ID Item label Response scale INTERN Did your include an internship component? 1. Yes 2. No 3. Don’t know INTLEARN Did you participate in other types of work-integrated learning (e.g. placements, practicums, consultancies, 1. Yes industry research projects) as part of your ? 2. No 3. Not applicable TRAINING Did your include training in…. 1. Yes (STATEMENTS) 2. No Pgreslink101/IPA Intellectual property awareness 3. Don’t know Pgreslink102/BUSMAN Business management Pgreslink103/ENTPNR Entrepreneurship COFUND Was your jointly supervised or co-funded by an industry partner? Please select 1/JOINTSUP. Yes it was jointly supervised all that apply. 2/COFUND. Yes it was co-funded 3/NOJSCF. No *(EXCLUSIVE) 4/DKJSCF. Don’t know *(EXCLUSIVE) Module G: Contact details CONTACT In a couple of years’ time, we are undertaking a follow up survey with graduates to see how their career has 1. Yes developed. 2. No Do you consent to being invited to participate in this important future research? For further information on the survey please click here (link to: https://www.qilt.edu.au/qilt-surveys). ALUMNI Do you consent to your details being passed on to your Alumni services at your institution for them to update 1. Yes your details? 2. No EMAIL We would like to make sure all your contact information is up to date. Is the email address below a permanent 1. Permanent email address is as above email address that we can use in the future? 2. Enter new permanent email address 3. Don’t have a permanent email address 4. Do not wish to be re-contacted by email 2021 GOS International Report 54
Question ID Item label Response scale ADDRESS The postal address we have for you is: 1. Yes 2. No *(DISPLAY AND EDIT ADDRESS ONE FIELD AT A TIME WHERE NECESSARY) 3. Do not wish to be contacted by post Is this correct? ADDRESS2 We do not have any postal information provided for you. Would you like to update your postal details? 1. Yes 2. No 3. Do not wish to be contacted by post C4 Would you like to be notified via email when the national data is released on the Quality Indicators for Learning 1. Yes and Teaching (QILT) website? 2. No NTFEMAIL What is the best email address to send the notification to? 1. Address as above 2. Enter new email address CATCH If you would like to provide any additional information relating to your current situation please use the space below. BRIDGE1 For the next part of the study we would like to hear from your work supervisor about their perceptions of your institution and higher education broadly through the Employer Satisfaction Survey (ESS). Without your supervisor’s input, results from this survey will be less useful to policy makers. The government uses input from graduates and employers to understand how well higher education institutions are preparing graduates for the workforce. Please click next to continue. END *(DISPLAY IF ONLINE) Thank you for your responses. Please click ‘Submit’ to finalise your survey. *(IF CATI) Thank you for your feedback, which will remain confidential. It plays a significant role in enhancing Australian higher education. If you would like further information, I can give you the details of some websites if you like: www.gos.edu.au www.srcentre.com.au/gos Just in case you missed it, my name is from the Social Research Centre and this survey is being conducted on behalf of The Australian Government Department of Education and Training. 2021 GOS International Report 55
3.2 Additional items A total of 18 institutions (15 universities and 3 NUHEIs) included institution specific items in the 2021 GOS. Institution specific items can be the same or a variation on questions included in prior rounds of GOS, or new questions entirely. Some of the content covered by institution specific items included questions relating to the net promoter score, work preparedness, further study plans, time spent in internships, volunteering and other co-curricular activities, and likelihood of recommending the course or institution to others. These institution-specific items were presented to graduates after the core instrument. A statement (The following items have been included by to gather feedback from recent graduates on issues important to their institution) was added before the items to further emphasise a clear distinction between the core instrument and any additional items. The CEQ (excluding from overall satisfaction) and the Graduate Attributes Scale (GAS) became institution opt-in from the 2021 GOS. A total of 68 institutions (31 universities and 37 NUHEIs) included the CEQ, and 67 institutions (33 universities and 34 NUHEIs) included the GAS. Stakeholders including the Australian Association of Graduate Employers (AAGE), Australian Collaborative Education Network Limited (ACEN), and Optometry Council of Australia and New Zealand (OCANZ) included items in the 2020 GOS. Content covered by the stakeholder items included employment pathways, work integrated learning and preparedness of optometry graduates. Institutions were invited to participate in these items, where applicable, by each of the relevant stakeholders. 2021 GOS International Report 56
The 90 per cent confidence intervals presented in this report were calculated using the Finite Population Correction Appendix 4 (FPC) to account for the relatively large size of the sample relative to the in-scope population. The FPC is generally used Construction when the sampling fraction exceeds 5 per cent. Because percentage agreement scores are reported for the 2021 GOS, the formula for the confidence interval of a of confidence proportion is used. The Agresti-Coull method is used as it performs well with both small and large counts, consistently producing intervals that are more likely to contain the true value of the proportion in comparison to the previous Wald intervals method. Where is the adjusted estimated proportion of satisfied responses, N is the size of the population in the relevant subgroup, n is the number of valid responses in the relevant subgroup, n1 is the number of positive responses in the relevant subgroup, 1.645 is the standard normal value for 90 per cent confidence and FPC is the Finite Population Correction term. The 90 per cent confidence interval of each estimated proportion is then calculated as the adjusted proportion plus or minus its 90 per confidence interval bound. Figure 6 Formula for a 90 per cent confidence interval using the Agresti-Coull method with FPC 2021 GOS International Report 57
Study areas for the QILT surveys, including the GOS, are defined in accordance with the ABS Australian Standard Appendix 5 Classification of Education (ASCED). The QILT website, and this report generally use 21 aggregated study areas as the basis of analysis. Targets for data collection are based on 45 study areas. Concordance between these study areas and ASCED Study area fields are listed below in Table 25. Details of the fields of education are available from the ABS website. Table 25 Study area concordance concordance Study area (21) Study area (45) FIeld of education 0 Non-award 0 Non-award 000000 1 Science and 1 Natural & physical 010000, 010300, 010301, 010303, 010500, 010501, 010503, mathematics sciences 010599, 010700, 010701, 010703, 010705, 010707, 010709, 010711, 010713, 010799, 019900, 019999 2 Mathematics 010100, 010101, 010103, 010199 3 Biological sciences 010900, 010901, 010903, 010905, 010907, 010909, 010911, 010913, 010915, 010999 4 Medical science 019901, 019903, 019905, 019907, 019909 & technology 2 Computing 5 Computing & 020000, 020100, 020101, 020103, 020105, 020107, 020109, & Information information systems 020111, 020113, 020115, 020117, 020119, 020199, 020300, Systems 020301, 020303, 020305, 020307, 020399, 029900, 029901, 029999 3 Engineering 6 Engineering – other 030000, 030100, 030101, 030103, 030105, 030107, 030109, 030111, 030113, 030115, 030117, 030199, 030500, 030501, 030503, 030505, 030507, 030509, 030511, 030513, 030515, 030599, 031100, 031101, 031103, 031199, 031700, 031701, 031703, 031705, 031799, 039900, 039901, 039903, 039905, 039907, 039909, 039999 7 Engineering – process 030300, 030301, 030303, 030305, 030307, 030399 & resources 8 Engineering – 030700, 030701, 030703, 030705, 030707, 030709, 030711, mechanical 030713, 030715, 030717, 030799 9 Engineering – civil 030900, 030901, 030903, 030905, 030907, 030909, 030911, 030913, 030999 10 Engineering – 031300, 031301, 031303, 031305, 031307, 031309, 031311, electrical & electronic 031313, 031315, 031317, 031399 11 Engineering – 031500, 031501, 031503, 031505, 031507, 031599 aerospace 2021 GOS International Report 58
Study area (21) Study area (45) ASCED field of education 4 Architecture and built 12 Architecture & urban 040000, 040100, 040101, 040103, 040105, 040107, 040199 environment environments 13 Building & construction 040300, 040301, 040303, 040305, 040307, 040309, 040311, 040313, 040315, 040317, 040319, 040321, 040323, 040325, 040327, 040329, 040399 5 Agriculture and 14 Agriculture & forestry 050000, 050100, 050300, 050500, 050700, 059900 environmental studies 15 Environmental studies 050900 6 Health services 16 Health services 060000, 060900, 060901, 060903, 060999, 061500, 061501, 061700, 061705, 061707, 061709, 061711, 061713, and support & support 061799, 061900, 061901, 061903, 061905, 061999, 069900, 069901, 069903, 069905, 069907, 069999 17 Public health 061300, 061301, 061303, 061305, 061307, 061309, 061311, 061399 7 Medicine 18 Medicine 060100, 060101, 060103, 060105, 060107, 060109, 060111, 060113, 060115, 060117, 060119, 060199 8 Nursing 19 Nursing 060300, 060301, 060303, 060305, 060307, 060309, 060311, 060313, 060315, 060399 9 Pharmacy 20 Pharmacy 060500, 060501 10 Dentistry 21 Dentistry 060700, 060701, 060703, 060705, 060799 11 Veterinary science 22 Veterinary science 061100, 061101, 061103, 061199 12 Rehabilitation 23 Physiotherapy 061701 24 Occupational therapy 061703 13 Teacher education 25 Teacher education – 070000, 070100, 070107, 070109, 070111, 070113, 070115, 070117, 070199, 070300, 070301, 070303, 079900, 079999 other 26 Teacher education – 070101 early childhood 27 Teacher education – 070103, 070105 primary & secondary 14 Business and 28 Accounting 080100, 080101 management 29 Business management 080300, 080301, 080303, 080305, 080307, 080309, 080311, 080313, 080315, 080317, 080319, 080321, 080323, 080399 30 Sales & marketing 080500, 080501, 080503, 080505, 080507, 080509, 080599 31 Management & 080000, 080900, 080901, 080903, 080905, 080999, 089900, 089901, 089903, 089999 commerce – other 32 Banking & finance 081100, 081101, 081103, 081105, 081199 2021 GOS International Report 59
Study area (21) Study area (45) ASCED field of education 40 Economics 091900, 091901, 091903 15 Humanities, culture 33 Political science 090100, 090101, 090103 and social sciences 34 Humanities inc history 090000, 090300, 090301, 090303, 090305, 090307, 090309, 090311, 090313, 090399, 091300, 091301, 091303, & geography 091700, 091701, 091703, 099900, 099901, 099903, 099905, 099999 35 Language & literature 091500, 091501, 091503, 091505, 091507, 091509, 091511, 091513, 091515, 091517, 091519, 091521, 091523, 091599 16 Social work 36 Social work 090500, 090501, 090503, 090505, 090507, 090509, 090511, 090513, 090515, 090599 17 Psychology 37 Psychology 090700, 090701, 090799 18 Law and paralegal 38 Law 090900, 090901, 090903, 090905, 090907, 090909, 090911, 090913, 090999 studies 39 Justice studies 091100, 091101, 091103, 091105, 091199 & policing 19 Creative arts 42 Art & design 100000, 100300, 100301, 100303, 100305, 100307, 100309, 100399, 100500, 100501, 100503, 100505, 100599, 109900, 109999 43 Music & performing arts 100100, 100101, 100103, 100105, 100199 20 Communications 44 Communication, media 100700, 100701, 100703, 100705, 100707, 100799 & journalism 21 Tourism, hospitality, 41 Sport & recreation 092100, 092101, 092103, 092199 personal services, sport and recreation 45 Tourism, hospitality 1101000, 110300, 120100, 120300, 120500, 129999 & personal services 2021 GOS International Report 60
This report is accompanied by additional benchmarking tables which may be used alongside this report and data visualisation to support Appendix 6 institutional benchmarking and analysis. Additional 6.1 GOS results tables and 6.1.1 Labour force outcomes figures This group of tables and figures includes labour force outcomes, including full-time and overall employment rates, labour force participation rate and median salary for graduates. Labour force outcomes can be viewed at the course level, by provider type, institution, gender, and study area. Table 26 Tables and figures associated with labour force outcomes Report table Sheet name Table title OVERALL_ALL_ALL_2Y Graduate employment and study outcomes, by study level, 2020 and 2021 Table 01 OVERALL_ALL_ALL_3Y Graduate employment and study outcomes, by study level, 2019 - 2021 Table 06 EMP_UG_ALL_2Y_AREA Undergraduate employment outcomes by study area, 2020 and 2021 (%) Table 07 EMP_PGC_ALL_2Y_AREA Postgraduate coursework employment outcomes by study area, 2020 and 2021 (%) EMP_PGR_ALL_2Y_AREA Postgraduate research employment outcomes by study area, 2020 and 2021 (%) EMP_UG_ALL_2Y Undergraduate employment outcomes, 2020 and 2021 (%) EMP_PG_ALL_2Y Postgraduate employment outcomes, 2020 and 2021 EMP_UG_ALL_2Y_DG Undergraduate employment outcomes by demographic group, 2020 and 2021 (%) EMP_PGC_ALL_2Y_DG Postgraduate coursework employment outcomes by demographic group, 2020 and 2021 (%) EMP_PGR_ALL_2Y_DG Postgraduate research employment outcomes by demographic group, 2020 and 2021 (%) EMP_UG_ALL_1Y_ Labour market outcomes of undergraduate graduates, by full-time study status, 2021 FURSTUD EMP_PG_ALL_1Y_ Labour market outcomes of postgraduate graduates, by full-time study status, 2021 FURSTUD EMP_UG_ALL_2Y_ Undergraduate employment outcomes by 45 study areas, 2020 and 2021 (%) AREA45 EMP_PGC_ALL_2Y_ Postgraduate coursework employment outcomes by 45 study areas, 2020 and 2021 (%) AREA45 2021 GOS International Report 61
Report table Sheet name Table title EMP_PGR_ALL_2Y_ Postgraduate research employment outcomes by 45 study areas, 2020 and 2021 (%) AREA45 EMP_UG_UNI_2Y_AREA Undergraduate employment outcomes by study area, universities only, 2020 and 2021 EMP_UG_NUHEI_2Y_ Undergraduate employment outcomes by study area, NUHEIs only, 2020 and 2021 AREA EMP_UG_UNI_2Y_DG Undergraduate employment outcomes by demographic group, universities only, 2020 and 2021 (%) EMP_UG_NUHEI_2Y_DG Undergraduate employment outcomes by demographic group, NUHEIs only, 2020 and 2021 (%) Table 02 EMP_UG_ALL_1Y_ International graduate employment outcomes by residence at time of survey (In CURCOUNTRY Australia, Overseas), undergraduate, 2021 Table 02 EMP_PGC_ALL_1Y_ International graduate employment outcomes by residence at time of survey (In CURCOUNTRY Australia, Overseas), postgraduate coursework, 2021 Table 02 EMP_PGR_ALL_1Y_ International graduate employment outcomes by residence at time of survey (In CURCOUNTRY Australia, Overseas), postgraduate research, 2021 Table 03 EMP_UG_ALL_1Y_ Undergraduate employment outcomes by home country of international graduates, COUNTRY 2021 Table 04 EMP_PGC_ALL_1Y_ Postgraduate coursework employment outcomes by home country of international COUNTRY graduates, 2021 Table 05 EMP_PGR_ALL_1Y_ Postgraduate research employment outcomes by home country of international COUNTRY graduates, 2021 EMP_UG_ALL_3Y_ Undergraduate employment rates by survey round, 2019-2021 (%) PERIOD EMP_PGC_ALL_3Y_ Postgraduate coursework employment rates by survey round, 2019-2021 (%) PERIOD EMP_PGR_ALL_3Y_ Postgraduate research employment rates by survey round, 2019-2021 (%) PERIOD SAL_UG_ALL_2Y_AREA_ Undergraduate median full-time salaries by study area and gender, 2020 and 2021 ($) SEX SAL_PGC_ALL_2Y_ Postgraduate coursework median full-time salaries by study area and gender, 2020 and AREA_SEX 2021 ($) SAL_PGR_ALL_2Y_ Postgraduate research median full-time salaries by study area and gender, 2020 and AREA_SEX 2021 ($) 2021 GOS International Report 62
Report table Sheet name Table title SAL_UG_ALL_2Y_DG Undergraduate median full-time salaries by demographic group, 2020 and 2021 ($) SAL_PGC_ALL_2Y_DG Postgraduate coursework median full-time salaries by demographic group, 2020 and 2021 ($) SAL_PGR_ALL_2Y_DG Postgraduate research median full-time salaries by demographic group, 2020 and 2021 ($) SAL_UG_ALL_2Y_ Undergraduate median full-time salaries by 45 study areas and gender, 2020 and 2021 AREA45_SEX ($) SAL_PGC_ALL_2Y_ Postgraduate coursework median full-time salaries by 45 study areas and gender, 2020 AREA45_SEX and 2021 ($) SAL_PGR_ALL_2Y_ Postgraduate research median full-time salaries by 45 study areas and gender, 2020 AREA45_SEX and 2021 ($) Table 08/Figure LF_UG_UNI_3Y Labour force indicators 2019-2021, undergraduates (universities only) 03/Figure 04 LF_PGC_UNI_3Y Labour force indicators 2019-2021, postgraduate coursework (universities only) LF_PGR_UNI_3Y Labour force indicators 2019-2021, postgraduate research (universities only) Table 09/Figure LF_UG_NUHEI_3Y Labour force indicators 2019-2021, undergraduates (NUHEIs only) 05 LF_PGC_NUHEI_3Y Labour force indicators 2019-2021, postgraduate coursework (NUHEIs only) LF_UG_UNI_2Y Undergraduate labour force indicators, universities only, 2020 and 2021 LF_UG_NUHEI_2Y Undergraduate labour force indicators, NUHEIs only, 2020 and 2021 FTE_UG_UNI_3Y_FIG Undergraduate full-time employment rate by university, 2019-2021 (%) SAL_UG_UNI_3Y_FIG Undergraduate median full-time salaries by university, 2019-2021 ($) FTE_UG_NUHEI_3Y_FIG Undergraduate full-time employment rate by NUHEI, 2019-2021 (%) SAL_UG_NUHEI_3Y_FIG Undergraduate median full-time salaries by NUHEI, 2019-2021 ($) FTE_PGC_UNI_3Y_FIG Postgraduate coursework full-time employment rate by university, 2019-2021 (%) FTE_PGC_NUHEI_3Y_FIG Postgraduate coursework full-time employment rate by NUHEI, 2019-2021 (%) SAL_PGC_UNI_3Y_FIG Postgraduate coursework median full-time salaries by university, 2019-2021 ($) FTE_PGR_UNI_3Y_FIG Postgraduate research full-time employment rate by university, 2019-2021 (%) SAL_PGR_UNI_3Y_FIG Postgraduate research median full-time salaries by university, 2019-2021 ($) Figure 01 FTE_UG_ALL_TS Undergraduate full-time employment, 2016-2021 (%) 2021 GOS International Report 63
Report table Sheet name Table title FTE_PGC_ALL_TS Postgraduate coursework full-time employment, 2016-2021 (%) FTE_PGR_ALL_TS Postgraduate research full-time employment, 2016-2021 (%) Figure 02 SAL_UG_ALL_TS Undergraduate median full-time salaries, 2016-2021 ($) SAL_PGC_ALL_TS Postgraduate coursework median full-time salaries, 2016-2021 ($) SAL_PGR_ALL_TS Postgraduate research median full-time salaries, 2016-2021 ($) PREFMHRS_UG_ALL_1Y_ Proportion of employed undergraduates seeking or not seeking more hours, by gender, E315 2021 (%) PREFMHRS_PGC_ Proportion of employed postgraduates (coursework) seeking or not seeking more hours, ALL_1Y_E315 by gender, 2021 (%) PREFMHRS_PGR_ Proportion of employed postgraduates (research) seeking or not seeking more hours, by ALL_1Y_E315 gender, 2021 (%) PARTEMP_UG_ALL_1Y_ Undergraduate Part-time employment, by study area and gender, as a proportion of all AREA_SEX employed graduates, 2021 (%) 6.1.2 Hours worked This group of tables explores the median hours actually worked in the week prior to completing the survey of graduates in the short-term, approximately four to six months after completing their course. Table 27 Tables associated with median usual hours and median actual hours worked Report table Sheet name Table title HOURS_UG_ALL_3Y Average hours worked per week for employed undergraduates by full-time/part-time status, 2019-2021 HOURS_PGC_ALL_3Y Average hours worked per week for employed postgraduates (coursework) by full-time/ part-time status, 2019-2021 HOURS_PGR_ALL_3Y Average hours worked per week for employed postgraduates (research) by full-time/part- time status, 2019-2021 HOURS_UG_ALL_3Y_PERIOD Average hours worked per week for employed undergraduates by full-time/part-time status and survey round, 2019-2021 HOURS_PGC_ALL_3Y_PERIOD Average hours worked per week for employed postgraduates (coursework) by full-time/ part-time status and survey round, 2019-2021 HOURS_PGR_ALL_3Y_PERIOD Average hours worked per week for employed postgraduates (research) by full-time/part- time status and survey round, 2019-2021 2021 GOS International Report 64
6.1.3 Away from work This group of tables presents the proportion of employed graduates who were away from work in the week prior to completing the survey. Reasons for being away from work include for holidays, sickness or any other reason, such as being stood down due to the impact of COVID-19. Table 28 Tables associated with the percentage of employed graduates away from work Report table Sheet name Table title AWAYWORK_UG_ALL_3Y Proportion of employed undergraduates who were away from work by full-time/part-time status, 2019-2021 (%) AWAYWORK_PGC_ALL_3Y Proportion of employed postgraduates (coursework) who were away from work by full- time/part-time status, 2019-2021 (%) AWAYWORK_PGR_ALL_3Y Proportion of employed postgraduates (research) who were away from work by full-time/ part-time status, 2019-2021 (%) AWAYWORK_UG_ALL_3Y_ Proportion of employed undergraduates who were away from work by full-time/part-time PERIOD status and survey round, 2019-2021 (%) AWAYWORK_PGC_ALL_3Y_ Proportion of employed postgraduates (coursework) who were away from work by full- PERIOD time/part-time status and survey round, 2019-2021 (%) AWAYWORK_PGR_ALL_3Y_ Proportion of employed postgraduates (research) who were away from work by full-time/ PERIOD part-time status and survey round, 2019-2021 (%) 6.1.4 Graduate occupations This group of tables presents the proportion of employed graduates and graduates employed full-time in different occupations. These occupations are coded from graduate description of their job and job role to a detailed ANZCO code. The results are presented here at the top ANZCO levels. In general, a managerial or professional occupation is considered an appropriate employment outcome after completing a higher education level qualification and a useful proxy for the “relevance” of graduates’ employment outcomes to their qualification. Table 29 Tables associated with occupation types of employed graduates Report table Sheet name Table title Table 10 OCC_UG_ALL_1Y_EMPTYPE Undergraduate occupation level, by employment type, 2021 (%) Table 10 OCC_PG_ALL_1Y_EMPTYPE Postgraduate occupation level, by employment type, 2021 (%) OCC_UG_ALL_1Y_AREA45 Undergraduate occupation level, total employed, by 45 study areas, 2021 (%) OCC_UG_UNI_1Y_EMPTYPE Undergraduate occupation level, by employment type, universities only, 2021 (%) OCC_UG_NUHEI_1Y_EMPTYPE Undergraduate occupation level, by employment type, NUHEIs only, 2021 (%) 2021 GOS International Report 65
Report table Sheet name Table title OCC_UG_UNI_1Y_AREA Undergraduate occupation level, total employed, by study area, universities only, 2021 (%) BROADOCC_UG_ALL_1Y_ Undergraduate occupation level, total employed, by study area, 2021 (%) EMPTYPE 6.1.5 Importance of the qualification This group of tables presents information on the extent to which graduates consider that it was important for them to have their specific or similar qualification, to be able to do their job. Table 30 Tables associated with the extent to which graduates considered their qualification important Report table Sheet name Table title QUALIMP_UG_ALL_1Y Importance of qualification for undergraduates’ current employment, 2021 (%) QUALIMP_PG_ALL_1Y Importance of qualification for postgraduates’ current employment, 2021 (%) 6.1.6 Extent to which qualification prepared graduates This group of tables present information on how well the qualification prepared graduates for their current job. Institutions also receive qualitative data in comment fields related to what the institution did well and what graduates considered could have been done better to prepare them for their current employment. Table 31 Tables associated with the extent to which the qualification prepared graduates for their current job Report table Sheet name Table title CRSPREP_UG_ALL_1Y Extent to which qualification prepared undergraduate level graduates for employment, 2021 (%) CRSPREP_PG_ALL_1Y Extent to which qualification prepared postgraduate level graduates for employment, 2021 (%) 6.1.7 Skills utilisation This group of tables present data exploring underutilisation of skills among graduates four to six months after completion of their course, and reasons for not working more hours. Results can be viewed by preference for more hours, gender, and study area. 2021 GOS International Report 66
Table 32 Tables associated with reasons for underutilisation of skills and education Report table Sheet name Table title RSNOMORE_UG_ALL_1Y_ Main reason not working more hours, of undergraduates employed part-time, by preference E315 for more hours and gender, 2021 (%) RSNOMORE_PGC_ALL_1Y_ Main reason not working more hours, of postgraduates (coursework) employed part-time, by E315 preference for more hours and gender, 2021 (%) RSNOMORE_PGR_ALL_1Y_ Main reason not working more hours, of postgraduates (research) employed part-time, by E315 preference for more hours and gender, 2021 (%) Table 11 RSOVRQ_UG_ALL_1Y Main reason for working in job in 2021 that doesn’t fully use skills and education, 2021 (%) Table 11 RSOVRQ_PGC_ALL_1Y Main reason for working in job in 2021 that doesn’t fully use skills and education, postgraduate coursework level graduates, 2021 (%) RSOVRQ_PGR_ALL_1Y Main reason for working in job in 2021 that doesn’t fully use skills and education, postgraduate research level graduates, 2021 (%) RSOVRQ_UG_ALL_1Y_AREA Undergraduate level graduates reporting occupation does not fully use skills and education, and main reason being no suitable jobs in my area of expertise, by study area, 2021 (%) RSOVRQ_PGC_ALL_1Y_AREA Postgraduate coursework level graduates reporting occupation does not fully use skills and education, and main reason being no suitable jobs in my area of expertise, by study area, 2021 (%) RSOVRQ_PGR_ALL_1Y_AREA Postgraduate research level graduates reporting occupation does not fully use skills and education, and main reason being no suitable jobs in my area of expertise, by study area, 2021 (%) SPOQSCL_UG_ALL_1Y Undergraduate level graduates reporting occupation does not fully use skills or education, 2021 (%) SPOQSCL_PG_ALL_1Y Postgraduate level graduates reporting occupation does not fully use skills or education, 2021 (%) 6.1.8 Further study This group of tables present the proportion of graduates engaged in further full-time study four to six months after completing their course. Table 33 Tables associated with graduates undertaking further full-time study Report table Sheet name Table title Table 15 FURSTUD_UG_ALL_1Y_ Undergraduate graduates in further full-time study, by original field of study (%) AREA Table 15 FURSTUD_PGC_ALL_1Y_ Postgraduate coursework graduates in further full-time study, by original field of study (%) AREA 2021 GOS International Report 67
Report table Sheet name Table title FURSTUD_PGR_ALL_1Y_ Postgraduate research graduates in further full-time study, by original field of study (%) AREA Table 16 FURSTUD_UG_ALL_1Y_FOE Study area of undergraduate graduates in further full-time study (%) Table 16 FURSTUD_PGC_ALL_1Y_FOE Study area of postgraduate coursework graduates in further full-time study (%) FURSTUD_PGR_ALL_1Y_FOE Study area of postgraduate research graduates in further full-time study (%) FURSTUD_UG_ALL_1Y_DG Further full-time study status for initial undergraduates, by demographic profile (%) FURSTUD_PG_ALL_1Y_DG Graduates in further full-time study, by initial postgraduate study level, by demographic profile, 2021 (%) Table 12 FURSTUD_UG_ALL_1Y_ International graduates in full-time study (undergraduate), by home country – 2021 COUNTRY Table 13 FURSTUD_PGC_ALL_1Y_ International graduates in full-time study (postgraduate coursework), by home country – COUNTRY 2021 Table 14 FURSTUD_PGR_ALL_1Y_ International graduates in full-time study (postgraduate research), by home country – 2021 COUNTRY 6.1.9 Satisfaction This group of tables present level of graduate satisfaction with their course. Results can be viewed by study level, institution type and demographic group. Table 34 Tables associated with graduate satisfaction Report table Sheet name Table title SAT_UG_ALL_2Y Satisfaction of undergraduate level graduates, 2020 and 2021 (% agreement) SAT_PGC_ALL_2Y Satisfaction of postgraduate coursework level graduates, 2020 and 2021 (% agreement) SAT_PGR_ALL_2Y Satisfaction of postgraduate research level graduates, 2020 and 2021 (% agreement) SAT_UG_ALL_2Y_AREA Satisfaction of undergraduate level graduates, by study area, 2020 and 2021 (% agreement) SAT_PGC_ALL_2Y_AREA Satisfaction of postgraduate coursework level graduates, by study area, 2020 and 2021 (% agreement) SAT_PGR_ALL_2Y_AREA Satisfaction of postgraduate research level graduates, by study area, 2020 and 2021 (% agreement) 2021 GOS International Report 68
Report table Sheet name Table title SAT_UG_ALL_1Y_DG Satisfaction of undergraduate level graduates, by demographic group, 2021 (% agreement) SAT_PGC_ALL_1Y_DG Satisfaction of postgraduate coursework level graduates, by demographic group, 2021 (% agreement) SAT_PGR_ALL_1Y_DG Satisfaction of postgraduate research level graduates, by demographic group, 2021 (% agreement) SAT_UG_UNI_2Y_AREA Satisfaction of undergraduate level graduates, by study area, 2020 and 2021 (% agreement) (Unis only) SAT_UG_NUHEI_2Y_AREA Satisfaction of undergraduate level graduates, by study area, 2020 and 2021 (% agreement) (NUHEIs only) 6.2 Methodological tables This group of tables relate to the operational and methodological aspects of the GOS including response rates, response characteristics such as student demographics and study area, as well as representativeness of the respondents as compared to the sample population. For more detailed discussion and analysis of methodology including the sampling design and approach, data collection and processing, data quality, response characteristics, approach to weighting and precision please refer to the 2021 GOS Methodological Report, which is available on the QILT website. Table 35 Tables associated with key project elements and response rates by institution Report table Sheet name Table title Table 17 SUMMARY_ALL_ALL_1Y GOS 2021 Collection Summary SUMMARY_ALL_ALL_1Y_1P GOS 2020 Collection Summary SUMMARY_ALL_ALL_1Y_2P GOS 2019 Collection summary SUMMARY_ALL_ALL_1Y_3P GOS 2018 Collection summary Table 19 RR_ALL_UNI_1Y GOS 2021 response rates by institution (universities only), Nov 2020, Feb 2021 and May 2021 collections Table 20 RR_ALL_NUHEI_1Y GOS 2021 response rates by institution (NUHEIs only), Nov 2020, Feb 2021 and May 2021 collections Table 18 RR_UG_ALL_1Y_INST_ GOS 2021 undergraduate response rates by institution type, November/Feb 2020/2021 and PERIOD May 2021 collections 2021 GOS International Report 69
Report table Sheet name Table title Table 18 RR_PGC_ALL_1Y_INST_ GOS 2021 postgraduate (coursework) response rates by institution type, November/Feb PERIOD 2020/2021 and May 2021 collections Table 18 RR_PGR_ALL_1Y_INST_ GOS 2021 postgraduate (research) response rates by institution type, November/Feb PERIOD 2020/2021 and May 2021 collections Table 36 Tables associated with response characteristics and representativeness Report table Sheet name Table title RR_ALL_ALL_1Y_TYPE GOS 2021 sample and response characteristics, by respondent type Table 21 RR_ALL_ALL_1Y_INT_TYPE GOS 2021 sample and response characteristics of international graduates, by respondent type RR_UG_ALL_1Y_INT_TYPE GOS 2021 sample and response characteristics of international undergraduates, by respondent type RR_PGC_ALL_1Y_INT_TYPE GOS 2021 sample and response characteristics of international postgraduate coursework graduates, by respondent type RR_PGR_ALL_1Y_INT_TYPE GOS 2021 sample and response characteristics of international postgraduate research graduates, by respondent type Table 22 RR_ALL_ALL_1Y_AREA GOS 2021 sample and response characteristics, by study area RR_UG_ALL_1Y_AREA GOS 2021 undergraduate sample and response characteristics, by study area RR_PGC_ALL_1Y_AREA GOS 2021 postgraduate coursework sample and response characteristics, by study area RR_PGR_ALL_1Y_AREA GOS 2021 postgraduate research sample and response characteristics, by study area RR_UG_ALL_1Y_COUNTRY Sample and response characteristics (undergraduate), by home country of international graduates – 2021 RR_PGC_ALL_1Y_COUNTRY Sample and response characteristics (postgraduate coursework), by home country of international graduates – 2021 RR_PGR_ALL_1Y_COUNTRY Sample and response characteristics (postgraduate research), by home country of international graduates – 2021 RR_ALL_ALL_1Y_INT GOS 2021 sample and response characteristics, by respondent type (international graduates) 2021 GOS International Report 70
JULY 2016