
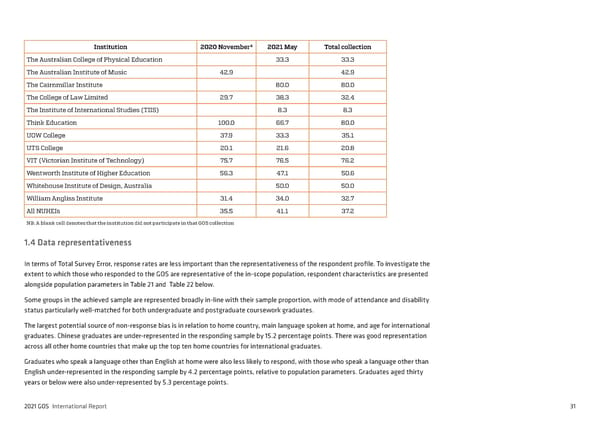
4 Institution 2020 November 2021 May Total collection The Australian College of Physical Education 33.3 33.3 The Australian Institute of Music 42.9 42.9 The Cairnmillar Institute 80.0 80.0 The College of Law Limited 29.7 38.3 32.4 The Institute of International Studies (TIIS) 8.3 8.3 Think Education 100.0 66.7 80.0 UOW College 37.9 33.3 35.1 UTS College 20.1 21.6 20.8 VIT (Victorian Institute of Technology) 75.7 76.5 76.2 Wentworth Institute of Higher Education 56.3 47.1 50.6 Whitehouse Institute of Design, Australia 50.0 50.0 William Angliss Institute 31.4 34.0 32.7 All NUHEIs 35.5 41.1 37.2 NB: A blank cell denotes that the institution did not participate in that GOS collection 1.4 Data representativeness In terms of Total Survey Error, response rates are less important than the representativeness of the respondent profile. To investigate the extent to which those who responded to the GOS are representative of the in-scope population, respondent characteristics are presented alongside population parameters in Table 21 and Table 22 below. Some groups in the achieved sample are represented broadly in-line with their sample proportion, with mode of attendance and disability status particularly well-matched for both undergraduate and postgraduate coursework graduates. The largest potential source of non-response bias is in relation to home country, main language spoken at home, and age for international graduates. Chinese graduates are under-represented in the responding sample by 15.2 percentage points. There was good representation across all other home countries that make up the top ten home countries for international graduates. Graduates who speak a language other than English at home were also less likely to respond, with those who speak a language other than English under-represented in the responding sample by 4.2 percentage points, relative to population parameters. Graduates aged thirty years or below were also under-represented by 5.3 percentage points. 2021 GOS International Report 31
 2021 International Graduate Outcomes Survey - QILT Page 35 Page 37