
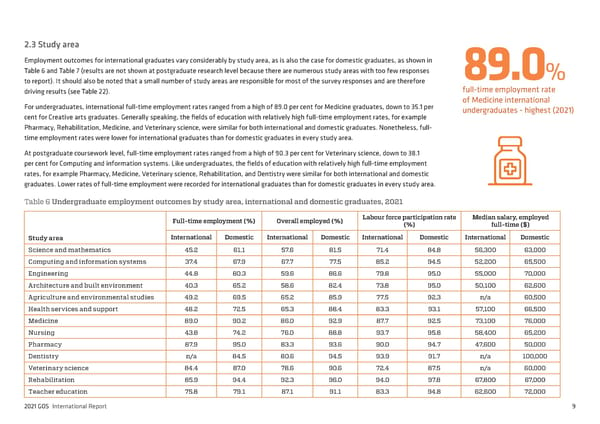
2.3 Study area Employment outcomes for international graduates vary considerably by study area, as is also the case for domestic graduates, as shown in Table 6 and Table 7 (results are not shown at postgraduate research level because there are numerous study areas with too few responses 89.0% to report). It should also be noted that a small number of study areas are responsible for most of the survey responses and are therefore driving results (see Table 22). full-time employment rate For undergraduates, international full-time employment rates ranged from a high of 89.0 per cent for Medicine graduates, down to 35.1 per of Medicine international cent for Creative arts graduates. Generally speaking, the fields of education with relatively high full-time employment rates, for example undergraduates - highest (2021) Pharmacy, Rehabilitation, Medicine, and Veterinary science, were similar for both international and domestic graduates. Nonetheless, full- time employment rates were lower for international graduates than for domestic graduates in every study area. At postgraduate coursework level, full-time employment rates ranged from a high of 90.3 per cent for Veterinary science, down to 38.1 per cent for Computing and information systems. Like undergraduates, the fields of education with relatively high full-time employment rates, for example Pharmacy, Medicine, Veterinary science, Rehabilitation, and Dentistry were similar for both international and domestic graduates. Lower rates of full-time employment were recorded for international graduates than for domestic graduates in every study area. Table 6 Undergraduate employment outcomes by study area, international and domestic graduates, 2021 Full-time employment (%) Overall employed (%) Labour force participation rate Median salary, employed (%) full-time ($) Study area International Domestic International Domestic International Domestic International Domestic Science and mathematics 45.2 61.1 57.6 81.5 71.4 84.8 56,300 63,000 Computing and information systems 37.4 67.9 67.7 77.5 85.2 94.5 52,200 65,500 Engineering 44.8 80.3 59.6 86.6 79.8 95.0 55,000 70,000 Architecture and built environment 40.3 65.2 58.6 82.4 73.8 95.0 50,100 62,600 Agriculture and environmental studies 49.2 69.5 65.2 85.9 77.5 92.3 n/a 60,500 Health services and support 48.2 72.5 65.3 88.4 83.3 93.1 57,100 66,500 Medicine 89.0 90.2 86.0 92.9 87.7 92.5 73,100 76,000 Nursing 43.8 74.2 76.0 88.8 93.7 95.8 58,400 65,200 Pharmacy 87.9 95.0 83.3 93.6 90.0 94.7 47,600 50,000 Dentistry n/a 84.5 80.6 94.5 93.9 91.7 n/a 100,000 Veterinary science 84.4 87.0 78.6 90.6 72.4 87.5 n/a 60,000 Rehabilitation 85.9 94.4 92.3 96.0 94.0 97.8 67,800 67,000 Teacher education 75.8 79.1 87.1 91.1 83.3 94.8 62,600 72,000 2021 GOS International Report 9
 2021 International Graduate Outcomes Survey - QILT Page 13 Page 15