
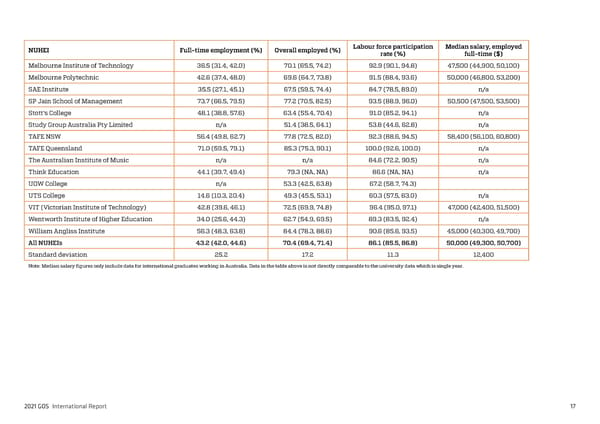
NUHEI Full-time employment (%) Overall employed (%) Labour force participation Median salary, employed rate (%) full-time ($) Melbourne Institute of Technology 36.5 (31.4, 42.0) 70.1 (65.5, 74.2) 92.9 (90.1, 94.8) 47,500 (44,900, 50,100) Melbourne Polytechnic 42.6 (37.4, 48.0) 69.6 (64.7, 73.8) 91.5 (88.4, 93.6) 50,000 (46,800, 53,200) SAE Institute 35.5 (27.1, 45.1) 67.5 (59.5, 74.4) 84.7 (78.5, 89.0) n/a SP Jain School of Management 73.7 (66.5, 79.5) 77.2 (70.5, 82.5) 93.5 (88.9, 96.0) 50,500 (47,500, 53,500) Stott's College 48.1 (38.8, 57.6) 63.4 (55.4, 70.4) 91.0 (85.2, 94.1) n/a Study Group Australia Pty Limited n/a 51.4 (38.5, 64.1) 53.8 (44.6, 62.8) n/a TAFE NSW 56.4 (49.8, 62.7) 77.8 (72.5, 82.0) 92.3 (88.6, 94.5) 58,400 (56,100, 60,800) TAFE Queensland 71.0 (59.5, 79.1) 85.3 (75.3, 90.1) 100.0 (92.6, 100.0) n/a The Australian Institute of Music n/a n/a 84.6 (72.2, 90.5) n/a Think Education 44.1 (39.7, 49.4) 79.3 (NA, NA) 86.6 (NA, NA) n/a UOW College n/a 53.3 (42.5, 63.8) 67.2 (58.7, 74.3) UTS College 14.6 (10.3, 20.4) 49.3 (45.5, 53.1) 60.3 (57.5, 63.0) n/a VIT (Victorian Institute of Technology) 42.8 (39.6, 46.1) 72.5 (69.9, 74.8) 96.4 (95.0, 97.1) 47,000 (42,400, 51,500) Wentworth Institute of Higher Education 34.0 (25.6, 44.3) 62.7 (54.9, 69.5) 89.3 (83.5, 92.4) n/a William Angliss Institute 56.3 (48.3, 63.8) 84.4 (78.3, 88.6) 90.6 (85.6, 93.5) 45,000 (40,300, 49,700) All NUHEIs 43.2 (42.0, 44.6) 70.4 (69.4, 71.4) 86.1 (85.5, 86.8) 50,000 (49,300, 50,700) Standard deviation 25.2 17.2 11.3 12,400 Note: Median salary figures only include data for international graduates working in Australia. Data in the table above is not directly comparable to the university data which is single year. 2021 GOS International Report 17
 2021 International Graduate Outcomes Survey - QILT Page 21 Page 23