
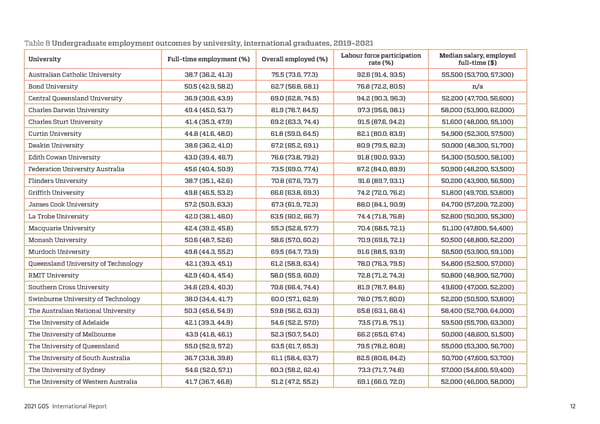
Table 8 Undergraduate employment outcomes by university, international graduates, 2019-2021 University Full-time employment (%) Overall employed (%) Labour force participation Median salary, employed rate (%) full-time ($) Australian Catholic University 38.7 (36.2, 41.3) 75.5 (73.6, 77.3) 92.6 (91.4, 93.5) 55,500 (53,700, 57,300) Bond University 50.5 (42.9, 58.2) 62.7 (56.8, 68.1) 76.8 (72.2, 80.5) n/a Central Queensland University 36.9 (30.6, 43.9) 69.0 (62.8, 74.5) 94.2 (90.3, 96.3) 52,200 (47,700, 56,600) Charles Darwin University 49.4 (45.0, 53.7) 81.9 (78.7, 84.5) 97.3 (95.6, 98.1) 58,000 (53,900, 62,000) Charles Sturt University 41.4 (35.3, 47.9) 69.2 (63.3, 74.4) 91.5 (87.6, 94.2) 51,600 (48,000, 55,100) Curtin University 44.8 (41.6, 48.0) 61.8 (59.0, 64.5) 82.1 (80.0, 83.9) 54,900 (52,300, 57,500) Deakin University 38.6 (36.2, 41.0) 67.2 (65.2, 69.1) 80.9 (79.5, 82.3) 50,000 (48,300, 51,700) Edith Cowan University 43.0 (39.4, 46.7) 76.6 (73.8, 79.2) 91.8 (90.0, 93.3) 54,300 (50,500, 58,100) Federation University Australia 45.6 (40.4, 50.9) 73.5 (69.0, 77.4) 87.2 (84.0, 89.9) 50,900 (48,200, 53,500) Flinders University 38.7 (35.1, 42.6) 70.8 (67.6, 73.7) 91.6 (89.7, 93.1) 50,200 (43,900, 56,500) Griffith University 49.8 (46.5, 53.2) 66.6 (63.8, 69.3) 74.2 (72.0, 76.2) 51,800 (49,700, 53,800) James Cook University 57.2 (50.9, 63.3) 67.3 (61.9, 72.3) 88.0 (84.1, 90.9) 64,700 (57,200, 72,200) La Trobe University 42.0 (38.1, 46.0) 63.5 (60.2, 66.7) 74.4 (71.8, 76.8) 52,800 (50,300, 55,300) Macquarie University 42.4 (39.2, 45.8) 55.3 (52.8, 57.7) 70.4 (68.5, 72.1) 51,100 (47,800, 54,400) Monash University 50.6 (48.7, 52.6) 58.6 (57.0, 60.2) 70.9 (69.6, 72.1) 50,500 (48,800, 52,200) Murdoch University 49.8 (44.3, 55.2) 69.5 (64.7, 73.9) 91.6 (88.5, 93.9) 56,500 (53,900, 59,100) Queensland University of Technology 42.1 (39.3, 45.1) 61.2 (58.9, 63.4) 78.0 (76.3, 79.5) 54,800 (52,500, 57,000) RMIT University 42.9 (40.4, 45.4) 58.0 (55.9, 60.0) 72.8 (71.2, 74.3) 50,800 (48,900, 52,700) Southern Cross University 34.6 (29.4, 40.3) 70.6 (66.4, 74.4) 81.9 (78.7, 84.6) 49,600 (47,000, 52,200) Swinburne University of Technology 38.0 (34.4, 41.7) 60.0 (57.1, 62.9) 78.0 (75.7, 80.0) 52,200 (50,500, 53,800) The Australian National University 50.3 (45.8, 54.9) 59.8 (56.2, 63.3) 65.8 (63.1, 68.4) 58,400 (52,700, 64,000) The University of Adelaide 42.1 (39.3, 44.9) 54.6 (52.2, 57.0) 73.5 (71.8, 75.1) 59,500 (55,700, 63,300) The University of Melbourne 43.9 (41.8, 46.1) 52.3 (50.7, 54.0) 66.2 (65.0, 67.4) 50,000 (48,600, 51,500) The University of Queensland 55.0 (52.9, 57.2) 63.5 (61.7, 65.3) 79.5 (78.2, 80.8) 55,000 (53,300, 56,700) The University of South Australia 36.7 (33.8, 39.8) 61.1 (58.4, 63.7) 82.5 (80.6, 84.2) 50,700 (47,600, 53,700) The University of Sydney 54.6 (52.0, 57.1) 60.3 (58.2, 62.4) 73.3 (71.7, 74.8) 57,000 (54,600, 59,400) The University of Western Australia 41.7 (36.7, 46.8) 51.2 (47.2, 55.2) 69.1 (66.0, 72.0) 52,000 (46,000, 58,000) 2021 GOS International Report 12
 2021 International Graduate Outcomes Survey - QILT Page 16 Page 18