
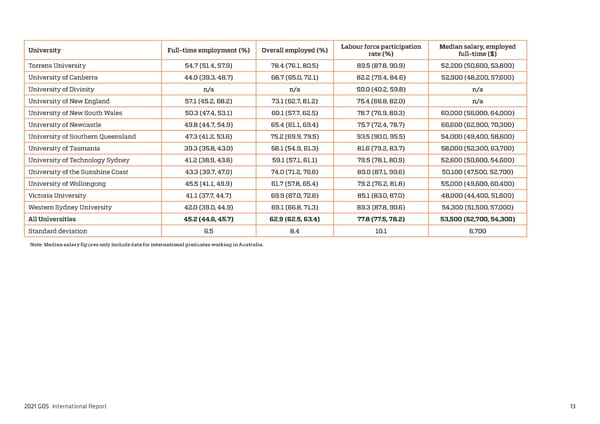
University Full-time employment (%) Overall employed (%) Labour force participation Median salary, employed rate (%) full-time ($) Torrens University 54.7 (51.4, 57.9) 78.4 (76.1, 80.5) 89.5 (87.8, 90.9) 52,200 (50,600, 53,800) University of Canberra 44.0 (39.3, 48.7) 68.7 (65.0, 72.1) 82.2 (79.4, 84.6) 52,900 (48,200, 57,600) University of Divinity n/a n/a 50.0 (40.2, 59.8) n/a University of New England 57.1 (45.2, 68.2) 73.1 (62.7, 81.2) 75.4 (66.8, 82.0) n/a University of New South Wales 50.3 (47.4, 53.1) 60.1 (57.7, 62.5) 78.7 (76.9, 80.3) 60,000 (56,000, 64,000) University of Newcastle 49.8 (44.7, 54.9) 65.4 (61.1, 69.4) 75.7 (72.4, 78.7) 66,600 (62,900, 70,300) University of Southern Queensland 47.3 (41.2, 53.6) 75.2 (69.9, 79.5) 93.5 (90.0, 95.5) 54,000 (49,400, 58,600) University of Tasmania 39.3 (35.8, 43.0) 58.1 (54.9, 61.3) 81.6 (79.2, 83.7) 58,000 (52,300, 63,700) University of Technology Sydney 41.2 (38.9, 43.6) 59.1 (57.1, 61.1) 79.5 (78.1, 80.9) 52,600 (50,600, 54,600) University of the Sunshine Coast 43.3 (39.7, 47.0) 74.0 (71.2, 76.6) 89.0 (87.1, 90.6) 50,100 (47,500, 52,700) University of Wollongong 45.5 (41.1, 49.9) 61.7 (57.8, 65.4) 79.2 (76.2, 81.8) 55,000 (49,600, 60,400) Victoria University 41.1 (37.7, 44.7) 69.9 (67.0, 72.6) 85.1 (83.0, 87.0) 48,000 (44,400, 51,600) Western Sydney University 42.0 (39.0, 44.9) 69.1 (66.8, 71.3) 89.3 (87.8, 90.6) 54,300 (51,500, 57,000) All Universities 45.2 (44.6, 45.7) 62.9 (62.5, 63.4) 77.8 (77.5, 78.2) 53,500 (52,700, 54,300) Standard deviation 6.5 8.4 10.1 6,700 Note: Median salary figures only include data for international graduates working in Australia. 2021 GOS International Report 13
 2021 International Graduate Outcomes Survey - QILT Page 17 Page 19