
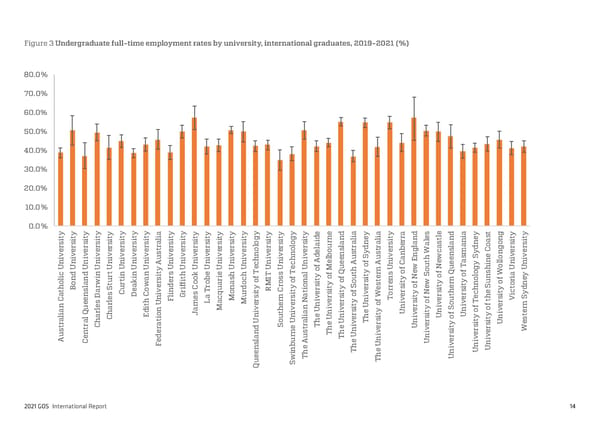
Figure 3 Undergraduate full-time employment rates by university, international graduates, 2019-2021 (%) 80.0% 70.0% 60.0% 50.0% 40.0% 30.0% 20.0% 10.0% 0.0% y y y y y y y a y yy y y y y y y y y y ee d y a y d s e d t g y y t t t ty i t t t t t g t t iae i t ra e l iaeys t iti i i i itititl ititii i i i i g itidrnnl l i r n l t nn a n iti s s s s s s s s ss si o s s o s a a a n a e a a s a n o s r r rsr r r r rar rr rsrsr rsl r r l r lu l r d r rs l a la d o g r rs e e ere e e e e t e ee e e e e e e o e eo s t t e b g c s C e e v v v v s v v v v v nov v n db s y s v n n W m y v iv i i i ivivivu ivivii i i i h i i h iv l enu Su i a h w s Se onivi n nin n n n n n n nn n c n c n Aee Af A C Et e eenayinl n A e e f u o u N uT ol U U U U U U Uy U U U Un Un U Un U U h Unfw o g h U Un t U t l o M t y rn e f f o s d n n i s h e e h TT Uns T f Q t s o S Q l W y ic i r inin r b sh f I s f a y f u i e y o o n iae l ndn t k a e it ri c n it o o s t n t N ny o u r o o a tur a w rsd fook a a o oM ro o sy o r s e i f w y n ofon l rw e if ro y y t y s o e iterit S t h B s Su e o C u n t R t iori Se e rr s h y d t a v r T o rdi Ci t t f v r y N s h e t y a s C D C i in s q es i i e r tr i ic en De l Ge a c M u s a ivrs o WTov itf e ue ech s V S l h F r rnrs e r f t r C e s r L a M e N y i s o o T n e it Un m e e nv e it o r iv ivf f e rn u a d n a M v h v n i v s Uny e y Sno ov ia rlh J t i U i r e t Un itn f i e l Qa E o ni iae n i iv U U y t l C i u l e s o y n s a a h t U o Una h Un Ths n r t it e r r r e iv r e y i s U t t C ra S e t T e U e U t s r s e s n v iv i e W u en d nd rnu Thh i n s er a T U v iv A C e l u A e U er i n F b h Un v n ns n e T e i U U e i h n e w T Th U u S Q 2021 GOS International Report 14
 2021 International Graduate Outcomes Survey - QILT Page 18 Page 20