
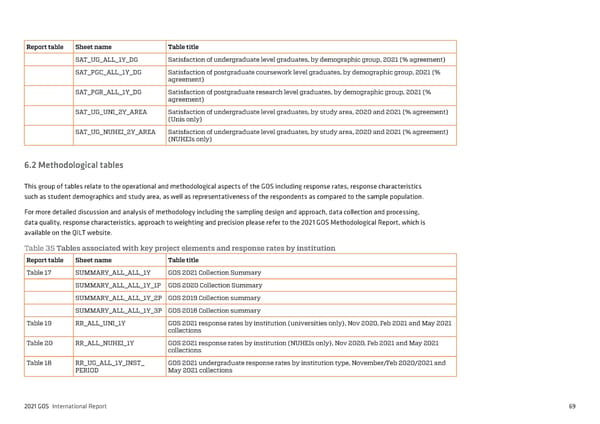
Report table Sheet name Table title SAT_UG_ALL_1Y_DG Satisfaction of undergraduate level graduates, by demographic group, 2021 (% agreement) SAT_PGC_ALL_1Y_DG Satisfaction of postgraduate coursework level graduates, by demographic group, 2021 (% agreement) SAT_PGR_ALL_1Y_DG Satisfaction of postgraduate research level graduates, by demographic group, 2021 (% agreement) SAT_UG_UNI_2Y_AREA Satisfaction of undergraduate level graduates, by study area, 2020 and 2021 (% agreement) (Unis only) SAT_UG_NUHEI_2Y_AREA Satisfaction of undergraduate level graduates, by study area, 2020 and 2021 (% agreement) (NUHEIs only) 6.2 Methodological tables This group of tables relate to the operational and methodological aspects of the GOS including response rates, response characteristics such as student demographics and study area, as well as representativeness of the respondents as compared to the sample population. For more detailed discussion and analysis of methodology including the sampling design and approach, data collection and processing, data quality, response characteristics, approach to weighting and precision please refer to the 2021 GOS Methodological Report, which is available on the QILT website. Table 35 Tables associated with key project elements and response rates by institution Report table Sheet name Table title Table 17 SUMMARY_ALL_ALL_1Y GOS 2021 Collection Summary SUMMARY_ALL_ALL_1Y_1P GOS 2020 Collection Summary SUMMARY_ALL_ALL_1Y_2P GOS 2019 Collection summary SUMMARY_ALL_ALL_1Y_3P GOS 2018 Collection summary Table 19 RR_ALL_UNI_1Y GOS 2021 response rates by institution (universities only), Nov 2020, Feb 2021 and May 2021 collections Table 20 RR_ALL_NUHEI_1Y GOS 2021 response rates by institution (NUHEIs only), Nov 2020, Feb 2021 and May 2021 collections Table 18 RR_UG_ALL_1Y_INST_ GOS 2021 undergraduate response rates by institution type, November/Feb 2020/2021 and PERIOD May 2021 collections 2021 GOS International Report 69
 2021 International Graduate Outcomes Survey - QILT Page 73 Page 75