
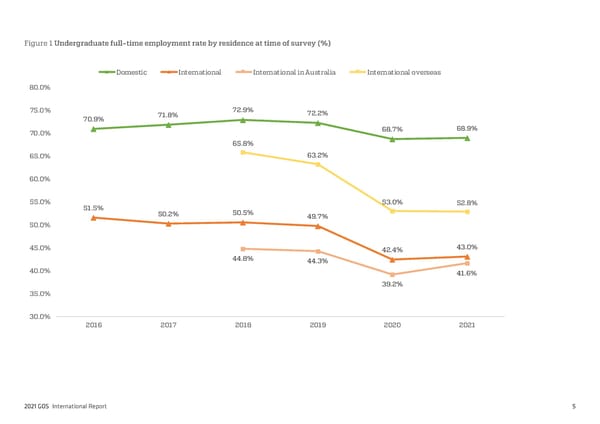
Figure 1 Undergraduate full-time employment rate by residence at time of survey (%) Domestic International International in Australia International overseas 80.0% 75.0% 71.8% 72.9% 72.2% 70.9% 70.0% 68.7% 68.9% 65.8% 65.0% 63.2% 60.0% 55.0% 53.0% 52.8% 51.5% 50.5% 50.2% 49.7% 50.0% 45.0% 42.4% 43.0% 44.8% 44.3% 40.0% 41.6% 39.2% 35.0% 30.0% 2016 2017 2018 2019 2020 2021 2021 GOS International Report 5
 2021 International Graduate Outcomes Survey - QILT Page 9 Page 11