
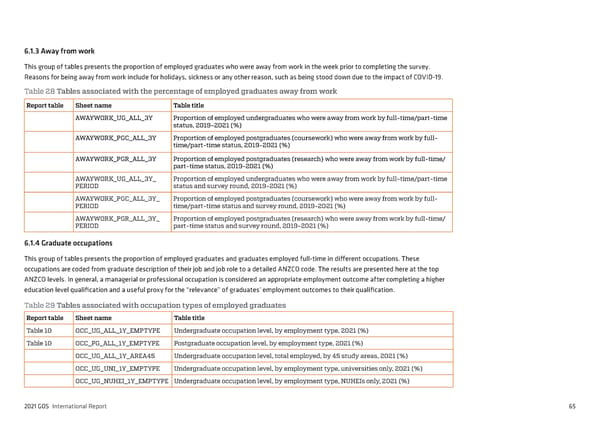
6.1.3 Away from work This group of tables presents the proportion of employed graduates who were away from work in the week prior to completing the survey. Reasons for being away from work include for holidays, sickness or any other reason, such as being stood down due to the impact of COVID-19. Table 28 Tables associated with the percentage of employed graduates away from work Report table Sheet name Table title AWAYWORK_UG_ALL_3Y Proportion of employed undergraduates who were away from work by full-time/part-time status, 2019-2021 (%) AWAYWORK_PGC_ALL_3Y Proportion of employed postgraduates (coursework) who were away from work by full- time/part-time status, 2019-2021 (%) AWAYWORK_PGR_ALL_3Y Proportion of employed postgraduates (research) who were away from work by full-time/ part-time status, 2019-2021 (%) AWAYWORK_UG_ALL_3Y_ Proportion of employed undergraduates who were away from work by full-time/part-time PERIOD status and survey round, 2019-2021 (%) AWAYWORK_PGC_ALL_3Y_ Proportion of employed postgraduates (coursework) who were away from work by full- PERIOD time/part-time status and survey round, 2019-2021 (%) AWAYWORK_PGR_ALL_3Y_ Proportion of employed postgraduates (research) who were away from work by full-time/ PERIOD part-time status and survey round, 2019-2021 (%) 6.1.4 Graduate occupations This group of tables presents the proportion of employed graduates and graduates employed full-time in different occupations. These occupations are coded from graduate description of their job and job role to a detailed ANZCO code. The results are presented here at the top ANZCO levels. In general, a managerial or professional occupation is considered an appropriate employment outcome after completing a higher education level qualification and a useful proxy for the “relevance” of graduates’ employment outcomes to their qualification. Table 29 Tables associated with occupation types of employed graduates Report table Sheet name Table title Table 10 OCC_UG_ALL_1Y_EMPTYPE Undergraduate occupation level, by employment type, 2021 (%) Table 10 OCC_PG_ALL_1Y_EMPTYPE Postgraduate occupation level, by employment type, 2021 (%) OCC_UG_ALL_1Y_AREA45 Undergraduate occupation level, total employed, by 45 study areas, 2021 (%) OCC_UG_UNI_1Y_EMPTYPE Undergraduate occupation level, by employment type, universities only, 2021 (%) OCC_UG_NUHEI_1Y_EMPTYPE Undergraduate occupation level, by employment type, NUHEIs only, 2021 (%) 2021 GOS International Report 65
 2021 International Graduate Outcomes Survey - QILT Page 69 Page 71