
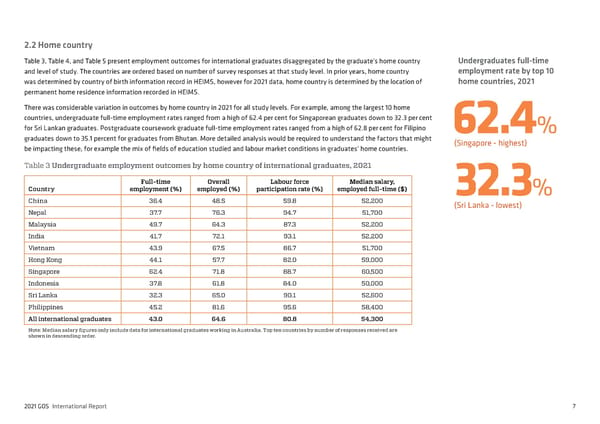
2.2 Home country Table 3, Table 4, and Table 5 present employment outcomes for international graduates disaggregated by the graduate’s home country Undergraduates full-time and level of study. The countries are ordered based on number of survey responses at that study level. In prior years, home country employment rate by top 10 was determined by country of birth information record in HEIMS, however for 2021 data, home country is determined by the location of home countries, 2021 permanent home residence information recorded in HEIMS. There was considerable variation in outcomes by home country in 2021 for all study levels. For example, among the largest 10 home countries, undergraduate full-time employment rates ranged from a high of 62.4 per cent for Singaporean graduates down to 32.3 per cent for Sri Lankan graduates. Postgraduate coursework graduate full-time employment rates ranged from a high of 62.8 per cent for Filipino 62.4% graduates down to 35.1 percent for graduates from Bhutan. More detailed analysis would be required to understand the factors that might (Singapore - highest) be impacting these, for example the mix of fields of education studied and labour market conditions in graduates’ home countries. Table 3 Undergraduate employment outcomes by home country of international graduates, 2021 Full-time Overall Labour force Median salary, Country employment (%) employed (%) participation rate (%) employed full-time ($) 32.3% China 36.4 48.5 59.8 52,200 (Sri Lanka - lowest) Nepal 37.7 76.3 94.7 51,700 Malaysia 49.7 64.3 87.3 52,200 India 41.7 72.1 93.1 52,200 Vietnam 43.9 67.5 86.7 51,700 Hong Kong 44.1 57.7 82.0 59,000 Singapore 62.4 71.8 88.7 60,500 Indonesia 37.8 61.8 84.0 50,000 Sri Lanka 32.3 65.0 90.1 52,600 Philippines 45.2 81.6 95.6 58,400 All international graduates 43.0 64.6 80.8 54,300 Note: Median salary figures only include data for international graduates working in Australia. Top ten countries by number of responses received are shown in descending order. 2021 GOS International Report 7
 2021 International Graduate Outcomes Survey - QILT Page 11 Page 13