
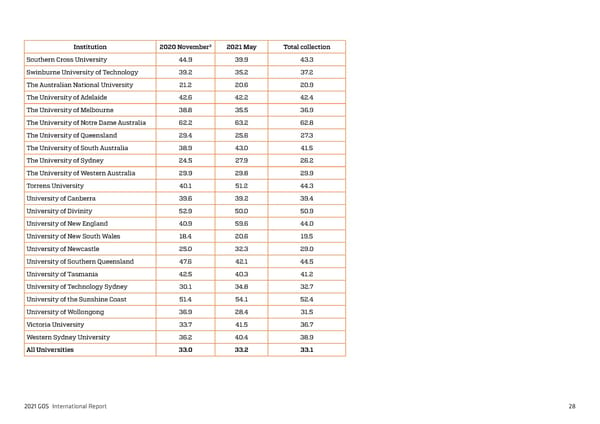
3 Institution 2020 November 2021 May Total collection Southern Cross University 44.9 39.9 43.3 Swinburne University of Technology 39.2 35.2 37.2 The Australian National University 21.2 20.6 20.9 The University of Adelaide 42.6 42.2 42.4 The University of Melbourne 38.8 35.5 36.9 The University of Notre Dame Australia 62.2 63.2 62.8 The University of Queensland 29.4 25.6 27.3 The University of South Australia 38.9 43.0 41.5 The University of Sydney 24.5 27.9 26.2 The University of Western Australia 29.9 29.8 29.9 Torrens University 40.1 51.2 44.3 University of Canberra 39.6 39.2 39.4 University of Divinity 52.9 50.0 50.9 University of New England 40.9 59.6 44.0 University of New South Wales 18.4 20.6 19.5 University of Newcastle 25.0 32.3 29.0 University of Southern Queensland 47.6 42.1 44.5 University of Tasmania 42.5 40.3 41.2 University of Technology Sydney 30.1 34.8 32.7 University of the Sunshine Coast 51.4 54.1 52.4 University of Wollongong 36.9 28.4 31.5 Victoria University 33.7 41.5 36.7 Western Sydney University 36.2 40.4 38.9 All Universities 33.0 33.2 33.1 2021 GOS International Report 28
 2021 International Graduate Outcomes Survey - QILT Page 32 Page 34