
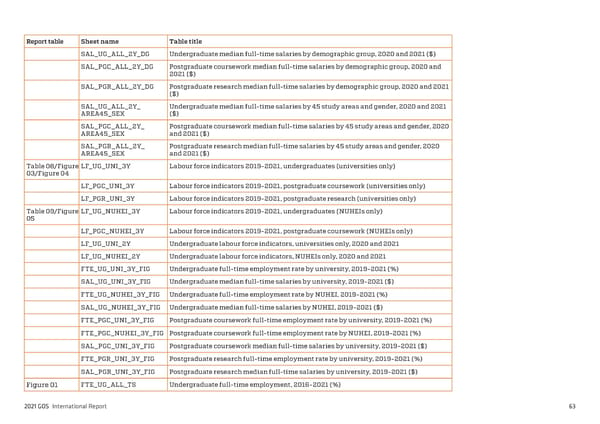
Report table Sheet name Table title SAL_UG_ALL_2Y_DG Undergraduate median full-time salaries by demographic group, 2020 and 2021 ($) SAL_PGC_ALL_2Y_DG Postgraduate coursework median full-time salaries by demographic group, 2020 and 2021 ($) SAL_PGR_ALL_2Y_DG Postgraduate research median full-time salaries by demographic group, 2020 and 2021 ($) SAL_UG_ALL_2Y_ Undergraduate median full-time salaries by 45 study areas and gender, 2020 and 2021 AREA45_SEX ($) SAL_PGC_ALL_2Y_ Postgraduate coursework median full-time salaries by 45 study areas and gender, 2020 AREA45_SEX and 2021 ($) SAL_PGR_ALL_2Y_ Postgraduate research median full-time salaries by 45 study areas and gender, 2020 AREA45_SEX and 2021 ($) Table 08/Figure LF_UG_UNI_3Y Labour force indicators 2019-2021, undergraduates (universities only) 03/Figure 04 LF_PGC_UNI_3Y Labour force indicators 2019-2021, postgraduate coursework (universities only) LF_PGR_UNI_3Y Labour force indicators 2019-2021, postgraduate research (universities only) Table 09/Figure LF_UG_NUHEI_3Y Labour force indicators 2019-2021, undergraduates (NUHEIs only) 05 LF_PGC_NUHEI_3Y Labour force indicators 2019-2021, postgraduate coursework (NUHEIs only) LF_UG_UNI_2Y Undergraduate labour force indicators, universities only, 2020 and 2021 LF_UG_NUHEI_2Y Undergraduate labour force indicators, NUHEIs only, 2020 and 2021 FTE_UG_UNI_3Y_FIG Undergraduate full-time employment rate by university, 2019-2021 (%) SAL_UG_UNI_3Y_FIG Undergraduate median full-time salaries by university, 2019-2021 ($) FTE_UG_NUHEI_3Y_FIG Undergraduate full-time employment rate by NUHEI, 2019-2021 (%) SAL_UG_NUHEI_3Y_FIG Undergraduate median full-time salaries by NUHEI, 2019-2021 ($) FTE_PGC_UNI_3Y_FIG Postgraduate coursework full-time employment rate by university, 2019-2021 (%) FTE_PGC_NUHEI_3Y_FIG Postgraduate coursework full-time employment rate by NUHEI, 2019-2021 (%) SAL_PGC_UNI_3Y_FIG Postgraduate coursework median full-time salaries by university, 2019-2021 ($) FTE_PGR_UNI_3Y_FIG Postgraduate research full-time employment rate by university, 2019-2021 (%) SAL_PGR_UNI_3Y_FIG Postgraduate research median full-time salaries by university, 2019-2021 ($) Figure 01 FTE_UG_ALL_TS Undergraduate full-time employment, 2016-2021 (%) 2021 GOS International Report 63
 2021 International Graduate Outcomes Survey - QILT Page 67 Page 69